Part 2 Radial Intracardiac Echocardiography in the EP Lab: Left Atrial Procedures

Left Atrial Intraprocedural Radial ICE Guidance:

Transseptal Punctures can be safely performed using radial ICE guidance.  A suitably sized Mullins introducer sheath (10-11 French) can be used to position the radial ICE catheter along the interatrial septum as shown in Figure 1.  The Mullins sheath provides enough maneuverability to adjust the ICE catheter position in both inferior-superior and anterior-posterior directions to optimize the location of transseptal puncture in the fossa ovalis.  Once ICE localization of transseptal needle showing tenting of the septum in suitable fossa is obtained LAO fluoroscopy is then used to guide the transseptal puncture and advancement of left atrial sheath.

 Radial ICE Guidance of Transseptal Puncture for Left Atrial Access
Radial ICE Guidance of Transseptal Puncture for Left Atrial Access

Figure 1 Radial ICE Guidance of Transseptal Puncture for Left Atrial Access.  The left and right atria are well-visualized with the ICE catheter in the right atrium along the interatrial septum in the fossa ovalis.  One can see the tenting evident when transseptal needle is in good contact with the interatrial septum.


Left Atrial Ablations can be enhanced and accomplished using intra left atrial radial ICE (with intraprocedural heparinization for ACT>300).  [1,2,3] Radial ICE is a useful adjunct imaging technique for several reasons.  First, direct visualization of the electrode-endocardial interface allows precise positioning of the ablation electrode to guide lesion formation.  Second, radial ICE permits the delivery of “focal” left atrial ablative lesions; the electrode kept in same location throughout energy application by manipulating the ablation electrode into firm, stable endocardial contact during continuous ICE imaging of the electrode–endocardial interface.  Third, the use of continuous radial ICE during atrial fibrillation ablations allows close monitoring of catheter position and endocardial contact while minimizing dependence on fluoroscopy.  Figure 2 depicts a typical view obtained when radial ICE is positioned in the left atrium using a steerable sheath (Agilis, St. Jude Medical, Inc., St. Paul, MN).

Intra Left Atrial Radial ICE Imaging During Atrial Fibrillation Ablation Left Pulmonary Venous Antrum Isolation

Figure 2  Intra Left Atrial Radial ICE Imaging During Atrial Fibrillation Ablation Left Pulmonary Venous Antrum Isolation. The radial ICE catheter is positioned at the entrance to the left PV antrum with the tip of the ablation catheter (Thermocool irrigated tip, Biosense Webster Inc, Diamond Bar, CA) located at ~9 o’clock on the antrum.  The inset shows the analogous location of ablation catheter on 3D CT reconstruction of the left PV antrum.

Detailed anatomy of the pulmonary veins can also aid in catheter positioning and stability as well as monitor for procedural complications (discussed later). Figure 3 provides views of the left and right pulmonary vestibules. The left upper (LUPV) and lower pulmonary veins (LLPV) are visualized as are the saddles. The right intervenous saddle is not as clearly differentiated as the left in this particular example to give the reader a better overall view of the structures surrounding the right pulmonary vestibule such as SVC, main PA, and Waterston’s groove (WG). Waterston’s groove is a fat-filled depression formed as the left and right atria fold into one another; Waterston’s groove is often dissected by surgeons to expose the left atrium. Radial ICE can be carefully placed within each individual pulmonary veins to guide catheter ablation as previously described. [1,2,3]


Radial ICE Anatomy of Left and Right Pulmonary Vestibules

Figure 3  Radial ICE Anatomy of Left and Right Pulmonary Vestibules. The right pulmonary vestibule is shown with the early portions of the upper and lower pulmonary veins. Superior to the right pulmonary veins one can see the main pulmonary artery and superior vena cava. The approximate location of Waterston’s groove is depicted by the solid line.  A more distal view of the left pulmonary vestibule (compared to Figure 2) clearly differentiates the upper and lower PV’s as well as the intervenous saddle.

Radial ICE can also help guide linear ablation along the LA posterior wall for mitral annular flutter.  Direct visualization of the left lower pulmonary vein, the posterior wall of the LA, the mitral annulus, and CS during ablation (both intra LA and CS) can improve catheter contact allowing for complete linear ablation and bidirectional block (see Figure 4).

Ablation Near Mitral Annulus

Figure 4  Ablation Near Mitral Annulus.  A depicts the intra-LA radial ICE catheter with ablation catheter along the floor of left atrium near mitral annulus. B shows a similar view demonstrating the ablation catheter in the CS.  Endocardial (and CS) contact and possible ablation injury can be visualized during lesion delivery.

Note: This is adapted from work I did with Dr. Sheetal Chandhok.

References:

1     Schwartzman D, Nosbisch J, Housel D. Echocardiographically guided left atrial ablation: characterization of a new technique. Heart Rhythm, V. 3 (2006), pp. 930–938.

2     Schwartzman D, Williams JL, “On the Electroanatomic Properties of Pulmonary Vein Antral Regions Enclosed by Encircling Ablation Lesions,” Europace , V. 11 (2009), pp. 435–444.

3     Chandhok S, Williams JL, Schwartzman DS, “Anatomical analysis of recurrent conduction after circumferential ablation,” J Intervent Card Electrophysiol, V. 27, No. 1 (January 2010), pp. 41-50.

Part 1 Radial Intracardiac Echocardiography in the EP Lab: Right Atrial Procedures

Introduction:

Radial ICE (UltraICE™, Boston Scientific, Natick, MA, USA) uses a mechanical, 9 Fr, 9 MHz catheter, with 360° radial image.  The ultrasound transducer rotates every 1.4° and with full mechanical rotation of the transducer (hence, 256 stacked lines of ultrasound data), a panoramic 360° image is created that is perpendicular to the catheter shaft at the tip.  Radial ICE does not offer doppler capability and image definition is not as good as phased array ICE.  Radial ICE’s 360° scan has a larger field of view and allows for a more comprehensive depiction (compared to phased array) of both atrial chambers and atrioventricular valves with their relationships and it also can be used as intravascular ultrasound for great vessels.  Phased-array 8 French, 4.5–11.5 MHz catheter (AcuNavTM Ultrasound Catheter, Biosense Webster Inc., Diamond Bar, CA) has a 90° sector image, Doppler capability, and is deflectable.  Radial ICE’s mechanical transducer is a non-deflectable catheter thus a steerable sheath (Zurpaz 8.5F Steerable Sheath, Boston Scientific Corporation, Natick, MA or Agilis, St. Jude Medical, St. Paul, MN) is required for precise catheter movements beyond transseptal puncture guidance.

Basic Cardiac Anatomy:

Figure 1 depicts the basic cardiac anatomy revealed with radial ICE and the analogous fluoroscopic views.  The high SVC view permits view of the SVC and ascending aorta and the PA comes into view as one moves inferiorly towards the low SVC.  The mid RA view tends to be the most useful view for orienting oneself in the right heart and (as discussed later) is the most useful view for transseptal access into the left atrium.  The low RA view is useful for delineating complex IVC and CS anatomy.


Figure 1  Basic Cardiac Anatomy with Radial Intracardiac Echocardiography (ICE).
Figure 1 Basic Cardiac Anatomy with Radial Intracardiac Echocardiography (ICE).

Figure 1  Basic Cardiac Anatomy with Radial Intracardiac Echocardiography (ICE).  The basic radial ICE anatomy is depicted starting superiorly in the high SVC (Level 1), low SVC (Level 2), mid RA (Level 3), and low RA (Level 4).  © 2013 Boston Scientific Corporation or its affiliates. All rights reserved. Used with permission of Boston Scientific Corporation.


Right Atrial Intraprocedural Radial ICE Guidance:

AV Node Reentrant Tachycardia requires careful catheter manipulation to modify the slow AV node pathway.  Traditionally, slow AV node pathway modification is guided by fluoroscopic images and electrogram morphology.  Radial ICE-guided AVNRT ablation has been well-described by Fisher et al. [1]    Figure 2 depicts the radial ICE anatomy of the slow AVN pathway during an ablation for AVNRT.  In this case, the patient had a persistent left superior vena cava (SVC) and ablation at attractive electrograms using fluoroscopic guidance did not yield a successful ablation.

Figure 2  Radial ICE Guidance during AVNRT Ablation of the Slow AV Node Pathway.
Figure 2 Radial ICE Guidance during AVNRT Ablation of the Slow AV Node Pathway.

Figure 2  Radial ICE Guidance during AVNRT Ablation of the Slow AV Node Pathway.  The left image depicts initial ablation catheter not in contact with the endocardial location of slow AVN pathway.  The right image clearly depicts adequate electrode-endocardial contact which resulted in a successful ablation.

Radial ICE imaging was then used (with ICE catheter directional guidance via steerable sheath) to anatomically guide the ablation electrode to the slow AVN pathway which is located in the region at the anterior edge of the CS os near the septal insertion of the tricuspid valve leaflet (e.g., the anterior border of triangle of Koch).  The left image shows the initial ablation catheter position and clearly demonstrates the electrode is not in contact with the endocardium.  Ablation catheter manipulation to the location depicted in the right image led to an immediately successful ablation.  Radial ICE guidance during AVNRT ablations allows one to visualize and ensure catheter stability during the ablation to avoid accidental catheter migration as compared to fluoroscopy which does not permit one to constantly monitor the electrode-endocardial interface.

AV Node Ablation can generally be performed under RAO and LAO fluoroscopic guidance however, there are times when the compact AV node cannot be ablated using traditional right atrial ablation techniques or only right bundle branch block can be obtained.  Radial ICE can be used to complete AV node ablation by catheter guidance to the leftward extension of the His purkinje system prior to attempting a retrograde aortic approach to AV node ablation (which often requires an 8 French right femoral arterial sheath).  Figure 3 depicts a typical site where complete heart block can be obtained by ablating more proximate to the leftward extension of the His bundle.

Figure 3  Completion of AV Nodal Ablation under Radial ICE Guidance.
Figure 3 Completion of AV Nodal Ablation under Radial ICE Guidance.

Figure 3  Completion of AV Nodal Ablation under Radial ICE Guidance.   This figure depicts radial ICE catheter location in the RVOT near the level of aortic valve.  The radial ICE allows catheter position nearer to the leftward extension of the His purkinje system in an attempt to complete AV node ablation.

Miscellaneous (Atrial Tachycardia, Difficult CS Anatomy)

Radial ICE can be used for detailed assessment of RA anatomy especially during mapping of difficult atrial tachycardias.  Figure 4 shows the level of RA detail radial ICE can provide to assist EP study catheter localization.

Figure 4  Radial ICE Assessment of RA Anatomy. Figure from Springer, Journal of Interventional Cardiac Electrophysiology
Figure 4 Radial ICE Assessment of RA Anatomy. Figure from Springer, Journal of Interventional Cardiac Electrophysiology

 Figure 4  Radial ICE Assessment of RA Anatomy.  Right atrial anatomy is nicely visualized with radial ICE and corresponding anatomic specimen.  One can see how adjunctive imaging during difficult RA ablation may help visualize catheter position and endocardial contact.  Figure taken from Springer, Journal of Interventional Cardiac Electrophysiology [2].

Oftentimes, catheter access of the CS can be difficult due to anatomic variants involving both the Eustachian ridge (when using femoral venous access) and Thebesian valves.  The Eustachian valve continues superiorly from the IVC as the Tendon of Todaro that forms the Eustachian ridge (forming the superior aspect of the triangle of Koch). [3]  Additionally, prior reviews of CS anatomy (4) revealed the presence of Thebesian valves (rudimentary valve covering CS os) in 80% of cases.  It covered one-fifth in 7%, one-third the os in 29%, one-half in 27%, two-thirds in 14%, and the entire os in 5%.  Figure 5 depicts radial ICE imaging of both anatomic variants.  A minimally fenestrated Thebesian valve can make CS access unfeasible as in this case.  A prominent Eustachian ridge can mandate CS access using a subclavian or jugular venous approach as it often impedes catheter placement when using a femoral venous approach.

Figure 5  Radial ICE Imaging of CS Anatomic Variants.
Figure 5 Radial ICE Imaging of CS Anatomic Variants.

Figure 5  Radial ICE Imaging of CS Anatomic Variants.  The left image shows a Thebesian valve with no obvious fenestrations covering the CS os.  The right image shows a prominent Eustachian ridge extending from the IVC and overlying the superior aspect of the CS os.

Check Back for:

Part 2 Radial Intracardiac Echocardiography in the EP Lab: Left Atrial Procedures

Part 3 Radial Intracardiac Echocardiography in the EP Lab: Monitoring Procedural Complications

Part 4 Radial Intracardiac Echocardiography in the EP Lab: Electroanatomic Correlates During Radial ICE

Note: This is adapted from work I did with Dr. Sheetal Chandhok.

References:

1     Fisher WG, Pelini MA, Bacon ME, “Adjunctive Intracardiac Echocardiography to Guide Slow Pathway Ablation in Human Atrioventricular Nodal Reentrant Tachycardia: Anatomic Insights,” Circulation, V. 96 (1997), pp. 3021-3029.

2     Morton JB and Kalman JM, “Intracardiac Echocardiographic Anatomy for the Interventional Electrophysiologist,” J Int Cardiac Electrophysiology, V. 13 (2005), pp. 11-16.

3     Ho SY and Ernst S, Anatomy for Cardiac Electrophysiologists (2012; Cardiotext Publishing, LLV, Minneapolis, MN).

4     Pejkovic B, Krajnc I, Anderhuber F, Kosutic D, “Anatomical Variations of the Coronary Sinus Ostium Area of the Human Heart,” J Int Med Research, V. 36 (2008), pp. 314-321.

Asystole Associated with Ablation near the Left Superior Pulmonary Vein

This is an interesting finding observed during a recent atrial fibrillation ablation performed in our Heart Rhythm Center.  The ablation paradigm has been previously described [1] and consists of a pulmonary venous antrum isolation using entrance and exit block criteria guided by intra left atrial radial intracardiac echocardiography (ICE). During the initial antrum encircling lesion asystole developed (see following figure), ablation was stopped, and sinus rhythm recovered within 10seconds.

Asystole During Ganglionic Plexi Ablation in LSPV

The following radial ICE image demonstrates the ablation catheter location in the superior aspect of the left pulmonary venous antrum near the left atrial appendage.

Radial ICE View LSPV Ganglion

Bradycardia is often seen during atrial fibrillation ablations when proximate to autonomic ganglionic plexi.  [2]  I routinely see fluctuations in basal sinus rate during pulmonary venous antrum ablations but this was more dramatic than the sinus rate changes I usually observe.  This location as seen on the intra left atrial radial ICE shot is slightly more anterior than the left superior ganglionic plexus is usually expected.  The following figure shows a CT reconstruction of the posterior left atrium and pulmonary venous antra.  The red dots depict a typical venous antrum ablation lesion set and the yellow areas denote the approximate locations of the ganglionic plexi. [3]  Discontinuation of ablation led to quick restoration of sinus rhythm and repeat ablation near this location to finalize lesion set did not result in repeat asystole or significant fluctuations in sinus rate.


Approximate Locations of Ganglionic Plexi

Another possible explanation for this finding is acute sinus node dysfunction (from damage to the sinus node artery, SNA) during ablation in the anterior left atrium.  Chugh et al present an excellent review of coronary arterial injury during ablation of atrial fibrillation. [4]  Though there was no obvious PR prolongation prior to the pause suggesting an autonomic effect, there was also no obvious sinus tachycardia or acceleration serving as a “harbinger of impending [sinus node] dysfunction.”    Though the SNA arises from the RCA in two-thirds of patients, the remainder of SNA arise from an early branch of the circumflex which “passes superiorly and to the right of the LAA and courses over the anterior LA before terminating at the cavoatrial junction.”  Less commonly, the SNA branches off a more distal portion of the circumflex and ascends in the lateral ridge between the appendage and the left pulmonary veins.  The patient had an uneventful post-ablation recovery.


References:

1                     Schwartzman D, Williams JL, “On the Electroanatomic Properties of Pulmonary Vein Antral Regions Enclosed by Encircling Ablation Lesions,” Europace , V. 11 (2009), pp. 435–444.

2                     Pappone C, et al “Pulmonary vein denervation enhances long-term benefit after circumferential ablation for paroxysmal atrial fibrillation,” Circulation, V. 109 (2004), p. 327.

3                     Katritsis DG et al, “Autonomic Denervation Added to Pulmonary Vein Isolation for Paroxysmal Atrial Fibrillation A Randomized Clinical Trial,” JACC, V. 62 (December 2013), pp. 2318–25.

4                     Chugh A et al, “Manifestations of coronary arterial injury during catheter ablation of atrial fibrillation and related arrhythmias,” Heart Rhythm, V. 10, No. 11 (November 2013), pp. 1638-1645.

Lessons Learned from Clinical Cardiology Performance Metrics

Our single specialty practice and 172-bed community hospital have been collaborating on performance measures for over three years. Over these years we have monitored several dozen metrics as shown in the Table below. Our Performance Metrics committee including hospital staff, administration and cardiologists meets to formulate, track, and assess metrics on a regular basis.

Table. Examples of Clinical Performance Metrics
Table of Metrics

General Concepts

Quality of care can be evaluated based upon three different concepts: [1]
1. Structure: characteristics of physicians and hospitals.
2. Process Data: components of the encounter between a health care professional and a patient.
3. Outcome Data: the patient’s subsequent health status.

Our performance metrics were selected based upon mutual consensus for both patient care and hospital process outcomes. There are obviously innumerable clinical metrics that can be selected based upon the hospital and subspecialty. This discussion will focus on the issues can arise during the selection, measuring, and evaluation of these clinical measures.

Choosing Metrics

Many of the metrics we chose were based on cardiac catheterization and electrophysiology laboratories because there were readily available process measures to choose from such as Door-to-Balloon times, case start times, procedural report turnaround times, and pre-procedure antibiotic administration. Care was taken not to lean too heavily on interventionalists or electrophysiologists over the noninvasive cardiologists. Certain clinical measures were not chosen for complicated reasons; for instance, post-procedure lengths of stay were not included in metrics for fear of “quicker-sicker” discharges in an attempt to meet performance goals. Furthermore, we ultimately decided that number of stents used during PCI may not be the most appropriate measure for inclusion in our performance metrics. It must be noted that both post-PCI length of stays and number of stents per procedure are data points included in the American College of Cardiology-National Cardiovascular Data Registry™ (ACC-NCDR).

We relied heavily on the Centers for Medicare and Medicaid Services (CMS) Core Measures; these are relatively easy metrics to measure and report because they are required by CMS. In addition, our hospital was prepared, and indeed had system personnel in place, to track these Core Measures. A constant issue for discussion in our Metrics Committee was how a particular metric was to be measured. Unless the data element is automatically captured, manual, often laborious and personnel intensive, chart review is undertaken.

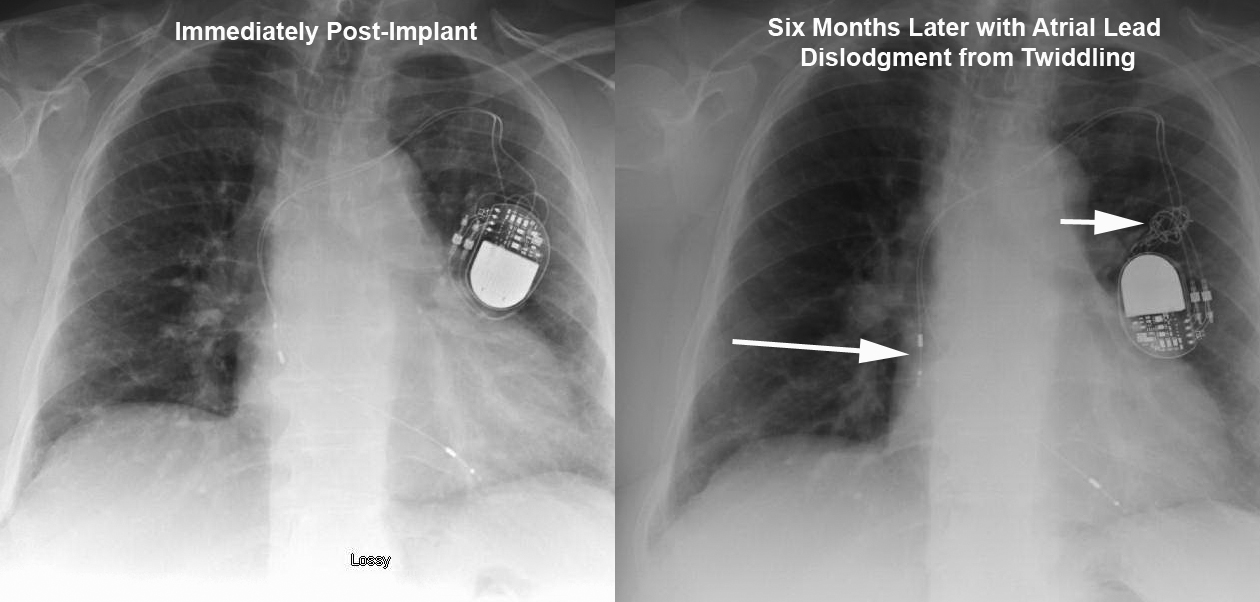
Our community hospital EP program is one of the few programs in the U.S. to publish complication outcomes for pacemaker and defibrillator implantations; with fewer major and minor complications than most published national trials or single academic centers, how should we to choose our goals for complication rates? In reviewing our hospital’s data compared to 50%-ile and 90%-ile centers involved in the ACC NCDR ICD database, it was interesting to see that for Outcome Metric 8 (Incidence of death or any adverse event at implant procedure), Metric 9 (Incidence of Lead Dislodgements All Patients), and Metric 10 (Failure to successfully place LV or coronary sinus lead) the numbers are incredibly low for these 50%-ile and 90%-ile centers (e.g., 0% rate of lead dislodgements?, 1% rate of failure to place LV lead when literature places the average at 8-12%?) and do not reflect complication incidences reported in peer-reviewed literature going back 20 years. These data rely on self-reporting by each center however, economics dictate that only a small minority of sites are audited for data veracity. It becomes difficult for a center to establish a national target for performance (given the current limitation of these national data) rather, local performance must be assessed and risk-stratified; this requires personnel AND advanced statistical methods that may not be readily available for all centers.

Law of Unintended Consequences

It is hard to predict every sequela that may result from a particular clinical metric. An interesting national discussion arose when reviewing Door-to-Balloon Time metrics. [2] The ACC-NCDR database allows centers to exclude patients from Door-to-Balloon Time metrics for reasons such as difficult vascular access or difficulty in crossing culprit lesion. Ellis et al opined that these exclusions were very subjective and could allow centers to “game” the system.

After public reporting of PCI outcomes was instituted, data from the NY PCI registry showed a reduction in mortality from 0.9% in 1997 to 0.58% in 2003. [3,4] Obviously, this may have resulted from improvement in PCI processes however, during that same time period, there was also a 30% decline in patients presenting with cardiogenic shock undergoing PCI. These data may indicate an avoidance of more critically ill patients in an attempt to lower mortality rates.

There are many examples of performance measures that have unintended consequences but vigilant monitoring for unintended consequences should be part of any improvement project. Robust data collection and regular monitoring should help with earlier detection of these unintended consequences.

We Can’t Define Quality but Know It When We See It

I often get calls from family and friends asking about which doctor I would recommend for various types of medical care. We all know the doctors we’d like evaluating our patients (or ourselves) but often this decision is based upon intangible qualities. A recent studied looked at judging surgical skills based upon surgical peer evaluations. [5] Surgeons performing bariatric surgery videotaped themselves performing the surgeries and blinded peers ranked these surgeons on perceived skill. The surgeons with higher ranks in skill experienced fewer perioperative complications. As a practicing clinical electrophysiologist, this type of performance evaluation is appealing because it offers the possibility of scoring performance that may not be accurately reflected by limited outcomes metrics (e.g., ACC NCDR ICD database as described above).

Pay for Maintenance of Quality AND/OR Improvement?

We were at a routine assessment meeting monitoring performance for one of our CV line’s metrics, Door-To-Balloon (DTB) Time; The standard DTB comprises the time it takes to recognize and treat and ST elevation MI with percutaneous coronary intervention. In attempting to tease out our performance (Time Cardiology Notified to STEMI reperfusion) versus the performance of the ER in obtaining and interpreting the electrocardiogram, I performed a quick and dirty power analysis (www.stat.ubc.ca/~rollin/stats/ssize/n1.html) to determine how many patients were required to find a statistically significant difference over a period of a month when our performance improved/deteriorated 5 min (e.g., from 70 to 65minutes Time Cardiology notified to STEMI reperfusion). This power analysis revealed that we would need to include 283 patients to obtain a statistically significant change of 5minutes in this metric. In the prior 11months, our center had 55 included STEMI’s in the metric. It is clear from these data that, although it is nice to see a decrease in 5minutes for this metric, one cannot clearly state this change is due to anything more than chance. Obviously, larger changes (such as changes of 15min or more) do not require as large a sample size, smaller changes seen after a clinical metric has “matured” may not reach statistical significance though one could argue still remain important (at least to our patients!).

We spend much time discussing what to do with metrics that we have improved. For instance, once we reach 100% of patients for a CHF Core Metric such as evidence-based beta blockade, should we then no longer use this metric? For me, it seems ludicrous to abandon a metric because you’ve improved to 100% adherence. Sometimes it seems as if metric achievement is looked at in a vacuum; the goal of performance metric evaluation is to improve patient care. There is precedent that pay for performance models can incorporate both performance improvement AND achievement. [6]

Can Performance-Based Reimbursement “Rescue” Community Hospitals?

Beyond simply improving patient care and healthcare delivery processes, performance metrics may offer respite to the financial concerns of community hospitals that are currently finding it difficult to stay independent. Community hospitals represent more than 85% of all US registered hospitals and are responsible for more than 95% of total hospital admissions. [7] The Medicare Payment Advisory Commission believes that Medicare’s payments should “recognize the value of enhanced patient care provided in teaching hospitals and other settings where residents and other health professionals train when the added value of patient care justifies its higher costs.” [8] Current reimbursement schemes favor academic over community centers without regard to outcomes; nationally recognized academic center in Pennsylvania receives ~39% higher (p=0.019) Medicare reimbursement for an acute myocardial infarction despite 95% of our patients receiving percutaneous coronary intervention (PCI) within 90 minutes of arrival (compared with the academic center’s rate of 81%), with no difference in 30-day mortality. [9] There is evidence that community hospitals may 1) have lower care delivery costs, 2) see a more elderly, ill population, and 3) may have fewer complications. [9,10,11,12,13,14] In an era of increasing cost containment and ‘pay-for-performance,’ center-dependent outcomes rather than generalization based on historical assumptions may allow community hospitals to “catch-up” to larger centers in terms of health care reimbursement dollars.

Lessons Learned

1. Only assess metrics that we can directly control and on our patients (though including consults becoming more necessary to get a good denominator of patients).
2. It is necessary to encourage additional resources (money and personnel) to track metrics.
3. Verify data! When we found that 0% of EP dictations were completed on time, we discovered a glitch in our EMR where the time stamps were incorrect.
4. There are two important caveats to remember when measuring quality of care: [1]
a. It is not possible to produce an error free measure of quality of care.
b. Poor measures of quality can unfairly harm institutions and physicians thus efforts should be made to use state-of-the-art measures, even if their use requires additional expenditures.

References
1 Brooks RH, McGlynn EA, Cleary PD, “Quality of Health Care. Part 2: Measuring Quality of Care,” NEJM, V. 335, No. 13 (September 26, 1996), pp. 966-970.
2 Ellis SG, Kapadia S, Heupler F, “The Weasel Clause: Excluding Patients From Door-to-Balloon Analyses,” JACC, V. 56, No. 21 (2010), p. 1763.
3 Khot UN, “Exploring the Risk of Unintended Consequences of Quality Improvement Efforts,” JACC, Vol. 60, No. 9 (2012), pp. 812-813.
4 Resnic FS, Welt FG, “The public health hazards of risk avoidance associated with public reporting of risk-adjusted outcomes in coronary intervention,” JACC, V. 53, No. (2009), pp. 825–30.
5 Birkmeyer JD, Finks JF, O’Reilly A, Oerline M, Carlin AM, Nunn AR, Dimick Janerjee M, and Birkmeyer NJO for the Michigan Bariatric Surgery Collaborative, “Surgical Skill and Complication Rates after Bariatric Surgery,” NEJM, V. 369 (October 10, 2013), pp. 1434-1442.
6 Casalino LP, Elster A, Eisenberg A, Lewis E, Montgomery J, Ramos D, “Will pay-for-performance and quality reporting affect health care disparities?” Health Aff, V. 2007, No. 26, w405-w414.
7 Fast Facts on US Hospitals, American Hospital Association website. Available at: http://www.aha.org/aha/resource-center/Statistics-and-Studies/fast-facts.html (accessed July 15, 2008).
8 Wilensky GR, Report to the Congress: Rethinking Medicare’s Payment Policies for Graduate Medical Education and Teaching Hospitals, Medicare Payment Advisory Commission, 1999.
9 US Department of Health & Human Services and Centers for Medicare & Medicaid Services CMS), Hospital Compare. Available at: http://www.hospitalcompare.hhs.gov (accessed February 8, 2010).
10 Newhouse JP. Accounting For Teaching Hospitals’ Higher Costs And What To Do About Them: There might now be more capacity in teaching hospitals than the market is willing to pay for. Health Affairs. 2003; 22(6):126-129.
11 Mechanic R, Coleman K, Dobson A, “Teaching hospital costs: implications for academic missions in a competitive market,” JAMA, V. 280, No. 11 (September 1998), pp. 1015-1019.
12 Zoorob R, Malpani V, Malpani S, “Adult inpatient training for a family practice residency: a university- versus community-based setting,” Fam Med, V. 34, No. 7 (Jul-Aug 2002), pp. 518-521.
13 Lawler FH, Horner RD, Hainer BL, “Process and outcome of critical care provided by community and academic primary care physicians,” Fam Med, V. 21, No. 4 (Jul-Aug 1989), pp. 268-272.
14 Williams JL, Lugg D, Gray R, Hollis D, Stoner M, Stevenson R, “Patient Demographics, Complications, and Hospital Utilization in 250 Consecutive Device Implants of a New Community Hospital Electrophysiology Program,” American Heart Hospital Journal, V. 8, No. 1 (Summer, 2010), pp. 33-39.

Pacemaker Patient Education Lecture 2: Reasons for Pacemaker Implantation

This is the second in a series of short (less than 5minutes), educational videos designed for patients and their care providers to develop a thorough understanding of pacemakers.  Lecture 2 Reasons for Pacemaker Implantation describes some of the common reasons patients undergo pacemaker implantation.

Your care providers have extensive training assessing the reasons—also called indications—that a patient may need a pacemaker. In particular, it is very important that the benefits of pacemaker implantation outweigh the risks of the pacemaker implant surgery (to be discussed later). The American College of Cardiology (ACC) is one of the major professional societies that develops guidelines to help care providers make educated clinical decisions that are based upon prior clinical studies. This is the basis of “evidence-based” medicine: the process by which clinical ideas are tested, reported, and reevaluated to decide the most appropriate care for a particular condition.

The ACC has developed guidelines that help care providers decide when a patient would be best served by a pacemaker.  The easiest rule to remember is: pacemakers are most appropriate for patients who are having symptoms related to an abnormally slow—or at times, fast—heart rate. These symptoms include: shortness of breath, chest pain, dizziness, fainting (also called syncope), heart failure, arrhythmias (such as ventricular tachycardia/fibrillation), or fatigue.   The decision to implant a pacemaker also requires evaluation of the permanence of the AV block. Electrolyte abnormalities (like potassium) can cause significant AV block, but correction of the abnormality can lead to resolution of the AV block. Some diseases—like Lyme Disease—often follow a natural course where the AV block is temporary and resolves as the disease is treated. Some types of AV block that occur during periods of vagal activation can reverse very quickly (e.g., nausea and dizziness during a blood draw may cause transient AV block or during sleep in patients with sleep apnea). In addition, after aortic valve surgery, inflammation can cause transient AV block that resolves within days of the operation. Finally, there are some diseases that warrant pacemaker implantation, because the AV block may continue to worsen (for example, sarcoidosis, amyloidosis, or neuromuscular diseases).


Don’t Be A Twiddler: Atrial Lead Dislodgement from Twiddler’s Syndrome

Twiddling Atrial Lead Dislodgment

Twiddler Intraop

This elderly patient presented 6months after a dual chamber pacemaker was implanted due to symptomatic chronotropic incompetence.  They reported recurrence of exertional shortness of breath that was experienced before pacemaker implantation.  Device interrogation revealed complete loss of capture in the atrial lead. The top Figure depicts lead orientation before (left) and after (right) patient twiddling resulted in loss of slack in both leads with frank atrial lead dislodgement.  Arrows show the dislodged atrial lead and knotted leads.  The bottom Figure shows the intraoperative finding of knotted leads in the pocket.  The leads were carefully unknotted, stylets placed, and leads repositioned with normal parameters.  Originally described in 1968 [1], twiddling refers to patient manipulation of pacemaker can or leads that may lead to malfunction.  It has a reported incidence of 0.07% in a series of 17000 patients. [2]  The patient underwent an uneventful lead revision by repositioning the atrial lead and adding slack to the ventricular lead.

1  Bayliss CE, Beanlands DS, Baird RJ, “The pacemaker-twiddler’s syndrome: a new complication of implantable transvenous pacemakers,” Can Med Assoc J, V. 99 (1968), pp. 371–3.

2  T. Fahraeus and C. J. Hoijer, “Early pacemaker twiddler syndrome,” Europace, Vol. 5 (July 2003), pp. 279-281.

Pacemaker Patient Education: The Basics of Heart Anatomy and Conduction System

This is the first in a series of short (less than 5minutes), educational videos designed for patients and their care providers to develop a thorough understanding of pacemakers.  Lecture 1 The Basics of Heart Anatomy and Conduction System introduces the core concepts of heart function necessary to understand the role of pacemakers in the management of heart disease.

Please check back for future lectures to be posted and register to receive updates from the Heart Rhythm Center.

Lecture 2: Reasons for Pacemaker Implantation

Lecture 3: What are Pacemakers and How Do They Work?

Lecture 4: Preoperative Workup and Evaluation

Lecture 5: Meeting the Implanting Physician

Lecture 6: The Implant Procedure

Lecture 7: Possible Complications of Pacemaker Implantation

Lecture 8: Post-operative Care of the Pacemaker Patient (The First Month)

Lecture 9:  Long-Term Care and Follow-up of the Pacemaker Patient

Lecture 10:  What are Pacemaker Device Recalls/Advisories/Alerts?

New Book for Patients that Need or Have Undergone Pacemaker Therapy

I wrote What is a Pacemaker? Cardiologist’s Guide for Patients and Their Care Providers to fill a gap in available resources for patients who have undergone or are under evaluation for pacemaker implantation. Please consider this a resource for your patients, colleagues, friends, and family.

The fastest growing population segment in the United   States, seniors commonly undergo pacemaker implantation. Although doctors’ offices typically provide short pamphlets on pacemaker implantation, there is rarely any comprehensive yet understandable reference material for the patients to obtain…until now. Explaining the “what, why, and how” of pacemaker implantation, this invaluable new guide provides an in-depth summary of pacemakers, from the initial patient evaluation and device implantation to the issues that could potentially arise during a long-term follow up.

Tunneled Left Ventricular Lead During Upgrade to a Biventricular Defibrillator

A very active octogenarian with history of ischemic cardiomyopathy, CAD status post bypass surgery and congestive heart failure (CHF) presented for evaluation. He had a dual chamber defibrillator (ICD) implanted in 2006 because of sustained ventricular tachycardia (VT).  His ejection fraction was 10-15% with extensive infarct and no evidence of ischemia on stress test.  He was having shortness of breath with mild exertion (and resting at times) giving him Class 3/4 CHF.  His electrocardiogram showed left bundle branch block and QRS duration of 160msec.

He was scheduled for upgrade of his defibrillator to a biventricular defibrillator with the addition of a left ventricular (LV) lead placed percutaneously in his coronary sinus.  Of note, his initial right ventricular ICD lead (Medtronic Sprint Fidelis) had to be replaced several years ago.  His in-situ ICD still had battery life and the decision was made to assess coronary sinus and left subclavian patiency prior to opening the ICD incision and risking device infection.  Peripheral venogram of his left upper extremity revealed an occluded left subclavian vein in the midline (see Figure).

L Subclav Veno

Right femoral venous access was obtained and a 5French deflectable octapolar EP catheter was used to document coronary sinus patency.  At this point, access to the left subclavian vein was attempted with the EP catheter without success.  A local venogram was then performed using a 5French multipurpose catheter and once again demonstrated an occluded left subclavian vein from the contralateral approach. See Figure below.

Local Venogram

Given the patient’s extreme age, the decision was made not to attempt opening his chronic left subclavian venous occlusion or attempt laser lead extraction of the abandoned RV lead.  We opted to place a coronary sinus LV lead via a patent right subclavian vein and percutaneously tunnel the lead to his existing left sided device.  A 2cm incision was made in the right infraclavicular region and LV lead was placed without difficulty in a posterolateral branch of the coronary sinus.  This lead was anchored to the right prepectoral fascia then tunneled subcutaneously to the exisiting left infraclavicular lead system.  Tunneling was performed without incident and the patient underwent a successful upgrade to a biventricular defibrillator.  The figure below depicts the chest xray and course of the tunneled LV lead. There was minimal postoperative discomfort along the course of the tunneled lead.

PA CXR of Tunneled LV Lead

Feasibility Study for Leadless Pacemaker Presented at Heart Rhythm Society

A study revealed at this year’s Heart Rhythm Society Meeting presented the first in-human results of a leadless implantable pacemaker. The device is about the size of a AAA battery and is implanted in the right ventricle. A limitation of current pacemakers is the reliance on implantable leads that can fracture or become infected. This device is the first step toward developing leadless pacing technologies. It remains to be seen how clinically useful this device will be but is expected to be available in Europe later this year.