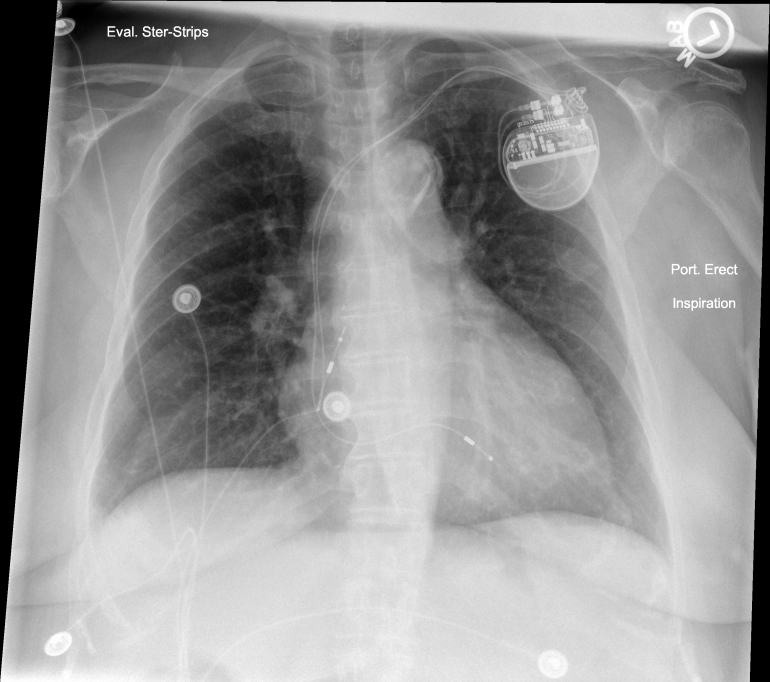
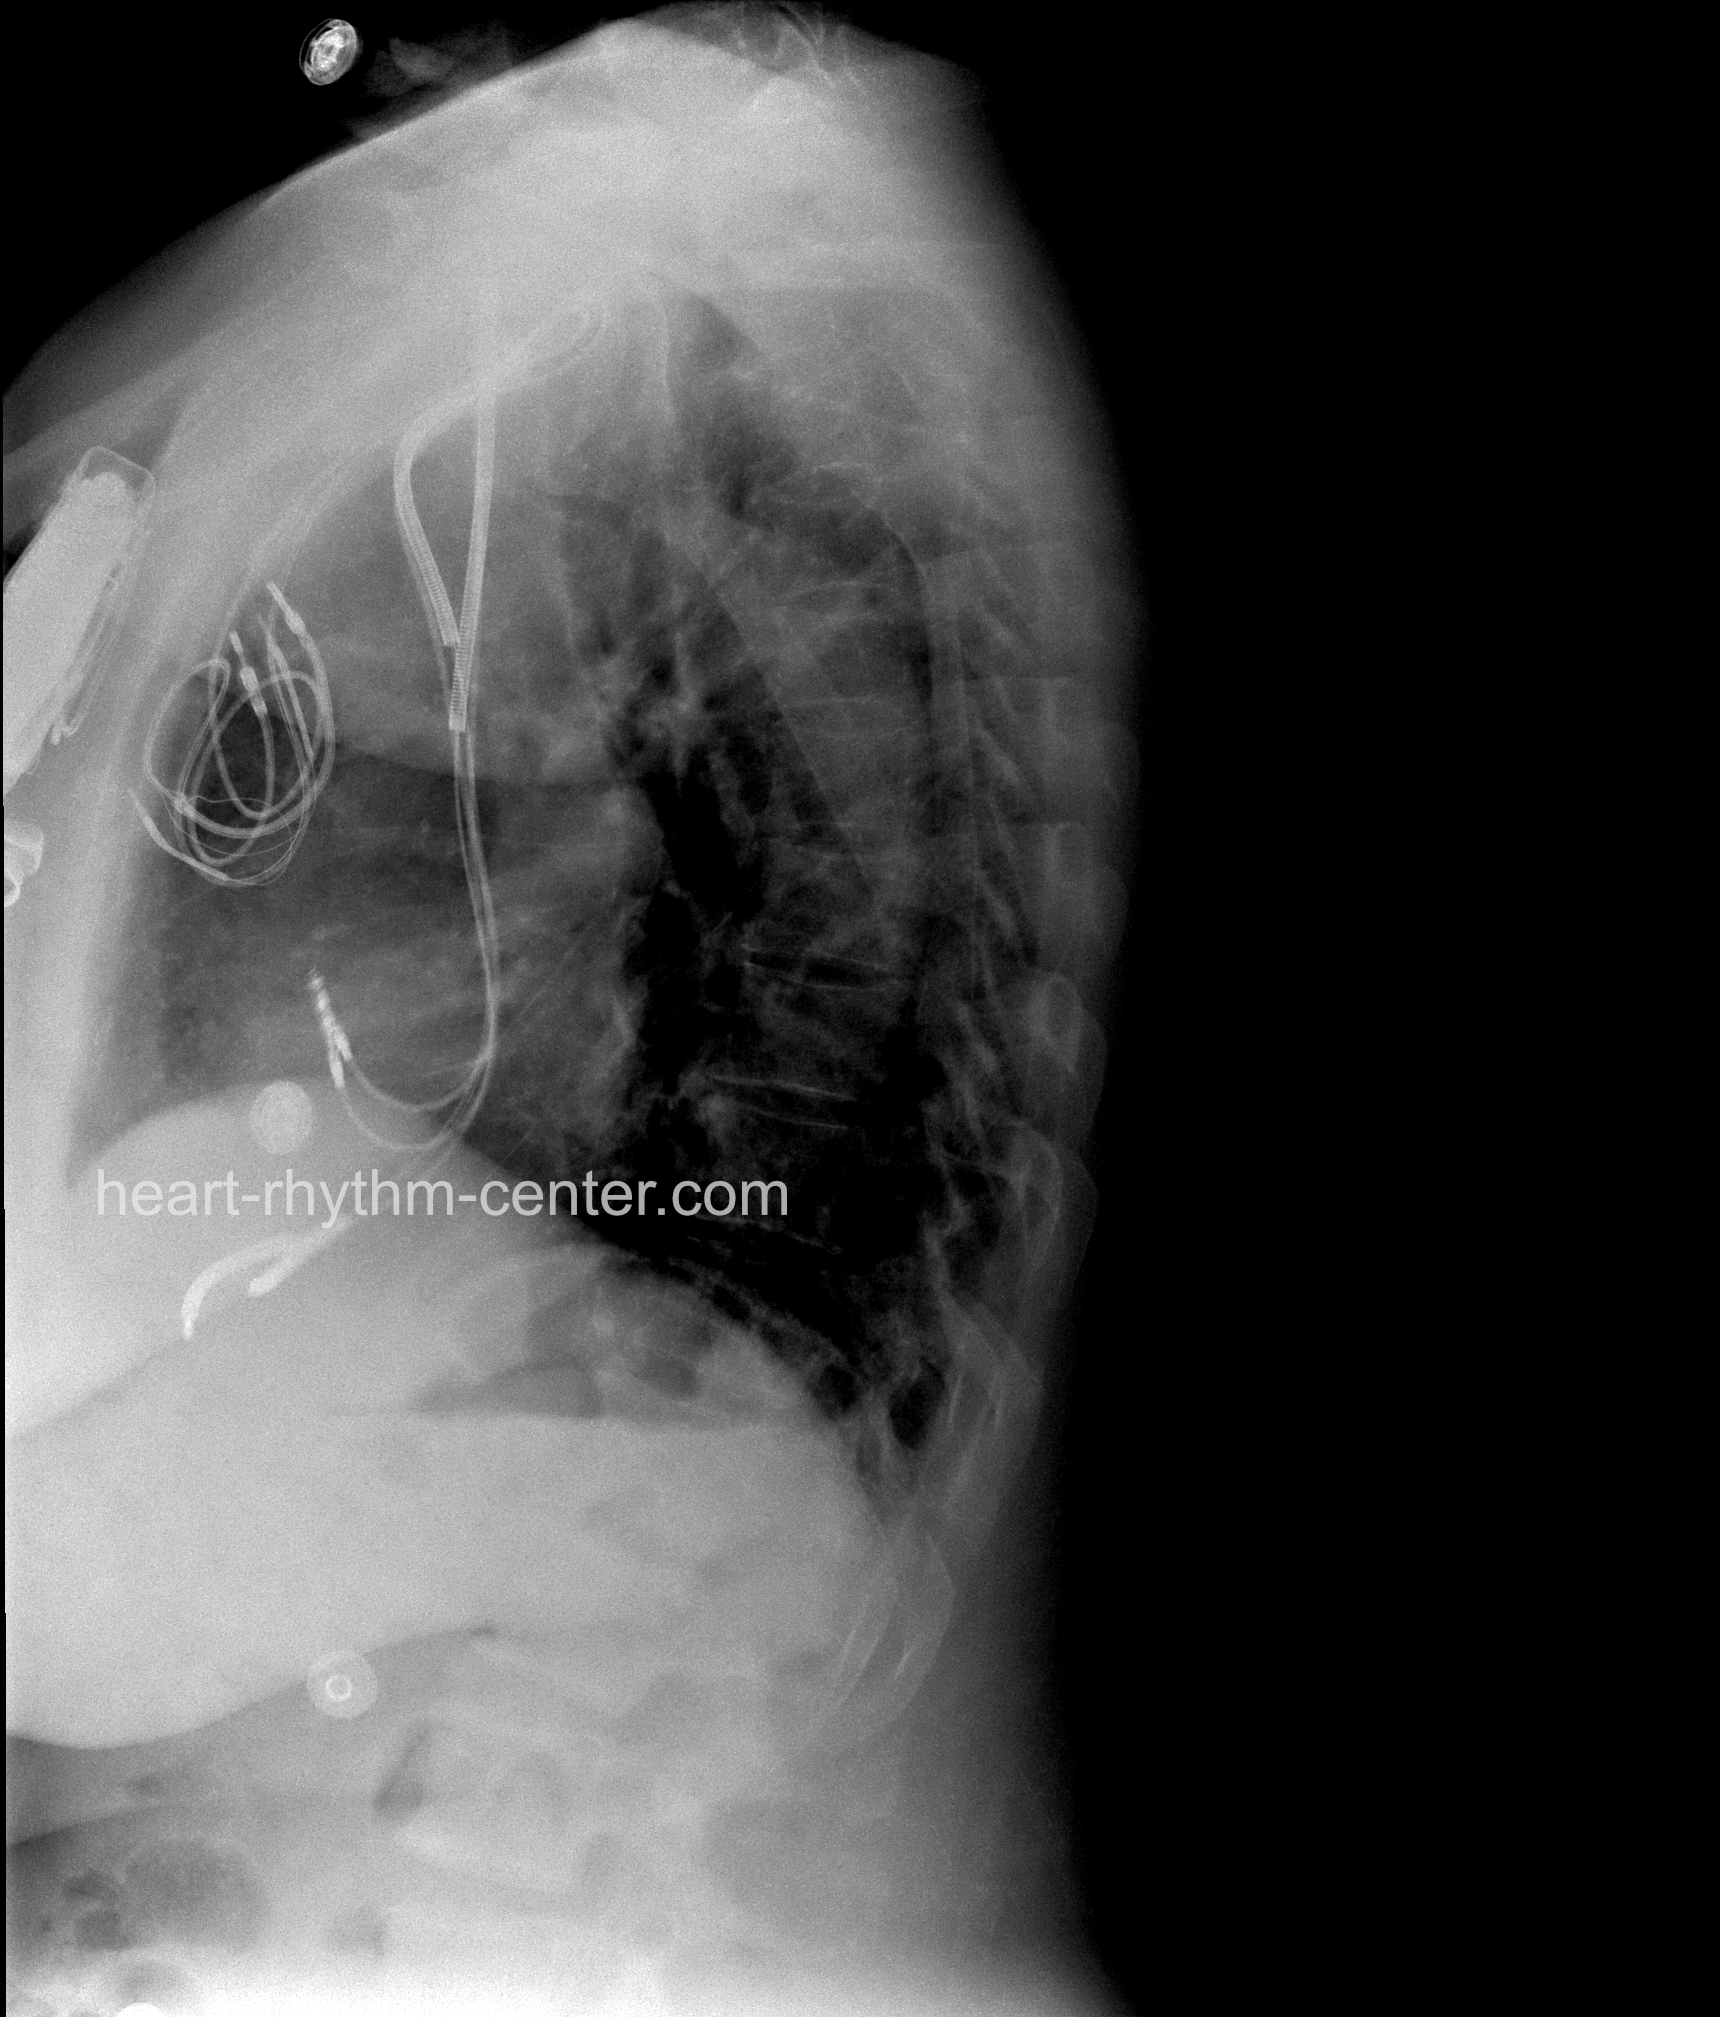
The following PA and Lateral CXR was obtained the day after an uneventful dual chamber pacemaker implantation placed via left cephalic cutdown.
One can see a radiopaque ribbon near the pacemaker can in both views raising the suspicion of a retained operative sponge. All skin dressings were removed and repeat CXR was performed.
Repeat PA CXR performed after dressing removed leaving steri-strips in place reveals that wound dressing had inadvertently used a radiopaque lap sponge as part of a pressure dressing. Nice case of “pseudo” sponge in the pocket but certainly caused some initial stress during CXR reading!
This PA and Lateral CXR was taken the day after an uneventful defibrillator implantation. I have saved these images for close to a decade as I never wanted to forget this is always a possibility. In full disclosure, this was not a procedure I performed.
This was an eye opening case of an operative sponge left in the pocket. As I recall, the patient was very gracious and sponge was extracted uneventfully the following day. Years later a practice partner of mine called me about an interesting case he was doing on a generator change in a can that went ERI at 8 years. He found an oddly healing pocket and ultimately dissected this sponge (see following picture) out from the pocket. Amazing that the pocket healed at all though clearly the pocket was very abnormal.
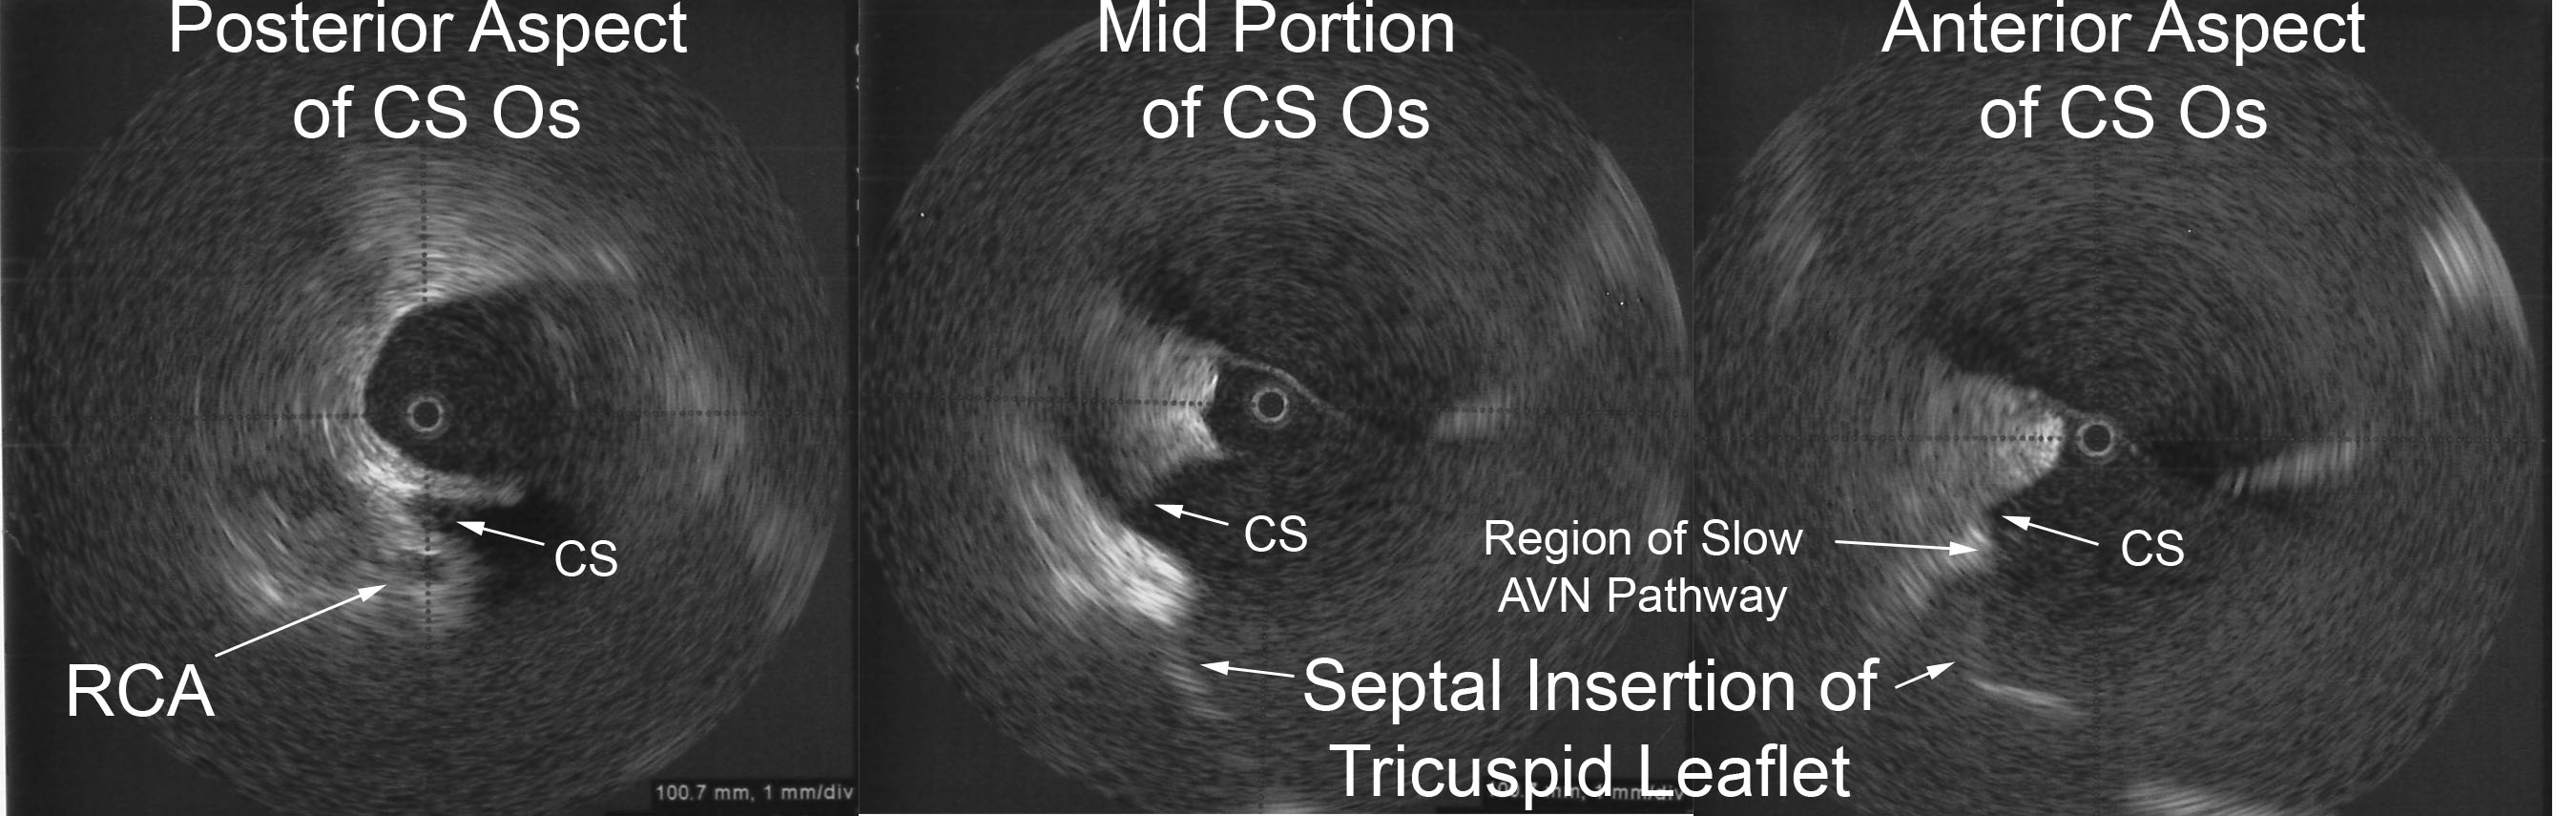
Radial intracardiac echocardiography adds significant anatomic correlation during invasive EP studies. In particular, coronary sinus (CS) anatomy can be evaluated during CS access or ablation of the slow AV nodal pathway during AVNRT ablations. A steerable sheath (Agilis, St. Jude Medical) flushing with saline holds a 9MHz radial ICE catheter (UltraICE, Boston Scientific Corporation) and is positioned along the inferoseptal aspect of the tricuspid annulus.
The left image shows the posterior aspect of the CS os and you can often visualize the right coronary artery (RCA) in this view. One can see a thickened roof of CS (or often a prominent Eustachian ridge). As the steerable sheath holding the ICE probe is advanced toward the right ventricle (RV), the main CS is brought into view as seen in the middle image. As you move more ventricular, the septal insertion of the tricuspid valve leaflet is brought into view. Finally, the right image depicts the radial ICE view when the anterior aspect of the CS os is brought into view as the probe is advanced even closer to the RV. This is where the traditional position of the slow AVN pathway is found – the slow AV node pathway is generally located at the anterior edge of the CS os near the septal insertion of the tricuspid leaflet.
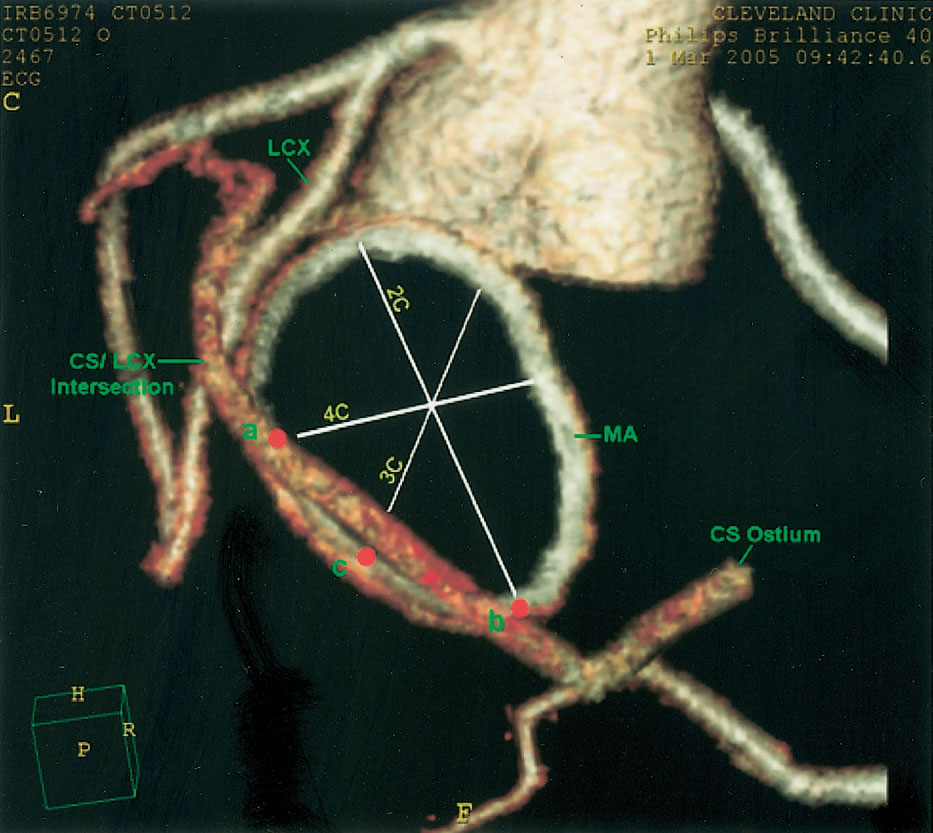
A nice anatomic study from Choure et al (“In Vivo Analysis of the Anatomical Relationship of Coronary Sinus to Mitral Annulus and Left Circumflex Coronary Artery Using Cardiac Multidetector Computed Tomography: Implications for Percutaneous Coronary Sinus Mitral Annuloplasty,” JACC, Vol. 48, No. 10, 2006) shows some detailed CT imaging of the relation between the coronary arteries and coronary sinus. The following image (taken from Choure et al) gives a nice visualization of the CS os and its relation to the RCA. One can see the circumflex crossing the mid-distal CS. They found the circumflex artery crossed the CS at a variable distance from the CS os (ranging 37 to 123 mm).
For more information about the use of radial ICE during EP studies:
Both non-irrigated and irrigated tip catheters for radiofrequency ablation (RFA) can cause steam pops with abrupt impedance rises probably owing to release of steam from excessive heating below the surface. [1] Saline irrigation maintains a low electrode-endocardial interface temperature during RFA at higher powers, which prevents an impedance rise and produces deeper and larger lesions. But you can see higher temperatures deeper in the cardiac wall (~3.5mm) than at the electrode-endocardial interface. This is thought to be due to direct resistive heating rather than by conduction of heat from the surface. [1] This excessive heating may cause water in the endocardium to vaporize into a gas bubble. Continued ablation (and hence heat formation) can cause this bubble to expand with increased pressure. If this gas bubble suddenly bursts inward toward the endocardium or outward to the epicardium, it can cause an audible “pop.”
The following video (courtesy of Dr. Dave Schwartzman, UPMC, Pittsburgh, PA) shows an ex vivo tissue preparation and formation of a steam pop during application of RFA. A significant concern of steam pops is the risk of cardiac perforation. Perforation with tamponade was seen in 1 of 62 (2%) VT ablations where a steam pop occurred. [2] The RFA applications with steam pops had a higher maximum power but did not differ in maximum catheter tip temperature. It reasons that steam pops in the pulmonary veins or atria may pose higher risk of perforation.
A middle-aged male with no significant medical history underwent an EP study and ablation for typical atrioventricular node reentrant tachycardia (AVNRT). The AVNRT ablation was being guided by radial intracardiac echocardiography. RFA (using power-control setting) is attempted at the anatomic location of the slow AVN pathway region at the anterior edge of the CS os near the septal insertion of the tricuspid valve leaflet (see Figure). Power was titrated from 5W to 30W but required 40W to demonstrate an accelerated junctional rhythm associated with ablation success. A steam pop was felt and evidence of a small defect in the endocardium in the region was noted on radial ICE as shown in Figure. There was no obvious microbubble formation evident on radial ICE prior to the steam pop. Subsequent echocardiograms demonstrated no evidence of perforation or tamponade and patient was asymptomatic at follow-up several weeks later.
Radial ICE showing the anatomic location of the slow AVN pathway and effects of a steam pop after RFA.
References:
1 Nakagawa H et al, “Comparison of In Vivo Tissue Temperature Profile and Lesion Geometry for Radiofrequency Ablation With a Saline-Irrigated Electrode Versus Temperature Control in a Canine Thigh Muscle Preparation,” Circulation (1995), V. 91, pp. 2264-2273.
2 Seiler J et al, “Steam pops during irrigated radiofrequency ablation: feasibility of impedance monitoring for prevention,” Heart Rhythm (Oct 2008), V. 5, No. 10, pp. 1411-1416.
Radial ICE can be used to obtain especially informative electroanatomic correlations and has been described extensively during atrial fibrillation ablations. [1,2,3] Aside from guiding the localization of pulmonary vein potentials during intra left atrial ICE guided procedures (shown in Radial ICE for Left Atrial Procedures) there are several instances where radial ICE facilitated electroanatomic correlates can discern situations where ablation is not necessary during atrial fibrillation ablations. The left atrial appendage is often located quite close to the left superior pulmonary vein and left atrial appendage far-field electrograms can be confused with pulmonary vein potentials if this is not suspected based upon electroanatomic correlation. Figure 1A depicts the radial ICE catheter positioned in the left superior pulmonary vein (adjacent to the left atrial appendage) and 1B shows the intracardiac electrograms (EGM) recorded in the left upper PV (darker, smaller amplitude) and LAA (lighter, larger amplitude); The LUPV signal appears to be a low-pass filtered version of the LAA signal.
Left Atrial Appendage Electrogram Mimicking Left Upper PV Potential
Figure 1 Left Atrial Appendage Electrogram Mimicking Left Upper PV Potential. Image A depicts the radial ICE catheter positioned in the left superior pulmonary vein and B shows the corresponding intracardiac electrogram (EGM) recorded in the left superior PV (darker, smaller amplitude). EGM’s from within the LUPV (darker) and LAA (lighter, larger amplitude) are superimposed.
One can also see potentials derived from contiguous myocardium outside the region subtended by catheter ablation of atrial fibrillation. [2,3] These potentials may be located near the LA roof in region of Waterston’s groove, proximal Bachmann’s bundle, and superior caval musculature. For example, distinct EGM’s can be recorded from within the right superior pulmonary vein that may look like, but do not represent, latent PV potentials.
Myocardial Potential in the Right Upper Pulmonary Vein that may Represent Bachmann’s Bundle Potential
Figure 2 Myocardial Potential in the Right Upper Pulmonary Vein that may Represent Bachmann’s Bundle Potential. The ICE image shows typical right pulmonary venous antral image with the tip of ICE catheter just within the entrance to the RUPV and the RLPV obliquely viewed. The ablation catheter is located on the roof of the RUPV. A myocardial potential located ~28msec after the onset of the surface P wave is shown before (pre-RFA) and after (post-RFA) ablation of pulmonary vein (PV) potential. We surmise (though cannot prove) that this myocardial potential represents Bachmann’s bundle potential (BB).
Figure 2 shows the typical radial ICE view when positioned in the right upper pulmonary vein. There are two distinct EGM’s recorded; the earlier signal ~28 msec after the onset of the surface P wave and the later signal ~70msec after the onset of the surface P wave. The later signal represents a true pulmonary vein (PV) potential that is successfully ablated and the earlier signal remains after the ablation; we surmise (though cannot prove) this represents Bachmann’s bundle potential (BB). This signal can often be seen in the right upper pulmonary vein <30msec after the onset of the surface P wave and its presence does not reflect residual PV potentials. Bachmann’s bundle (also called the interauricular band) has a myoarchitecture that displays parallel alignment of fibers along distinct muscle bundles. [5] Bachmann’s bundle extends from the SVC, crossing the interatrial groove, passing leftward in the left atrium.
Discussion:
Intracardiac radial ICE can provide detailed anatomy, guide catheter ablation, enhance procedural safety, and facilitate ablative strategies; it is readily available but generally underutilized. Furthermore, ICE has utility for reducing fluoroscopy times by rendering the operator less dependent upon traditional fluoroscopic monitoring of catheter movement and position. [4,6] Radial intracardiac echo offers 360º views of cardiac anatomy not commonly encountered with traditional phased array catheter or even transthoracic/transesophageal echo though it offers comprehensive utility in guiding EP procedures.
References:
1 Schwartzman D, Nosbisch J, Housel D. Echocardiographically guided left atrial ablation: characterization of a new technique. Heart Rhythm, V. 3 (2006), pp. 930–938.
2 Schwartzman D, Williams JL, “On the Electroanatomic Properties of Pulmonary Vein Antral Regions Enclosed by Encircling Ablation Lesions,” Europace , V. 11 (2009), pp. 435–444.
3 Chandhok S, Williams JL, Schwartzman DS, “Anatomical analysis of recurrent conduction after circumferential ablation,” J Intervent Card Electrophysiol, V. 27, No. 1 (January 2010), pp. 41-50.
4 Ferguson JD, Helms A, Mangrum JM, Mahapatra S, Mason P, Bilchick K, McDaniel G, Wiggins D, and DiMarco JP, “Catheter ablation of atrial fibrillation without fluoroscopy using intracardiac echocardiography and electroanatomic mapping,” Circ Arrhythm Electrophysiol, V. 2, No. 6 (December 2009), pp. 611-619.
5 HO02 Ho SY, Anderson RH, Sánchez-Quintana D.Atrial structure and fibres: morphologic bases of atrial conduction. Cardiovascular Res. 2002;54:325-336.
6 Khaykin Y, Skanes A, Whaley B, Hill C, Beardsall M, Seabrook C, Wulffhart Z, Oosthuizen, Gula L, Verma A, “Real-time integration of 2D intracardiac echocardiography and 3D electroanatomical mapping to guide ventricular tachycardia ablation,” Heart Rhythm, V. 5, No. 10 (October 2008), pp. 1396-1402.
Esophageal Proximity can be monitored to guide locations of ablation to help minimize risk of esophageal damage. The entire length of esophagus that is contiguous with the left atrial posterior wall can be visualized with intra left atrial ICE to monitor ablation delivery and power titration. [1] Figure 1A shows the typical location of the esophagus during an atrial fibrillation ablation. Ablation over the esophagus is avoided or power is titrated to minimize risk of esophageal damage. Endocardial thrombi or coagulum can be detected using radial ICE as shown in Figure 1B. Left atrial damage can also be monitored using radial ICE. Figure 1C shows an unusual case of a tear or rent in the endocardium discovered during an atrial fibrillation ablation. Finally, though radial ICE is not the ideal imaging modality to evaluate for pericardial effusions given its limited far-field resolution. Figure 1D shows the pericardial space in view when an intra-left ventricular ICE position is utilized.
Radial ICE to Monitor for Intraprocedural Complications.
Figure 1 Radial ICE to Monitor for Intraprocedural Complications. Image A shows the left pulmonary vestibule with catheter evident at 9 o’clock and the esophagus viewed obliquely at ~7 o’clock. Image B shows a coagulum versus thrombus adherent to the endocardium. Image C shows a left atrial endocardial tear that did not result in pericardial effusion. Image D shows the pericardial space when ICE catheter positioned across the mitral annulus in the LV.
References:
1 Ren JF, Lin D, Marchlinski FE, Callans DJ, Patel V. Esophageal imaging and strategies for avoiding injury during left atrial ablation for atrial fibrillation. Heart Rhythm. 2006;3: 1156-1161.
Transseptal Punctures can be safely performed using radial ICE guidance. A suitably sized Mullins introducer sheath (10-11 French) can be used to position the radial ICE catheter along the interatrial septum as shown in Figure 1. The Mullins sheath provides enough maneuverability to adjust the ICE catheter position in both inferior-superior and anterior-posterior directions to optimize the location of transseptal puncture in the fossa ovalis. Once ICE localization of transseptal needle showing tenting of the septum in suitable fossa is obtained LAO fluoroscopy is then used to guide the transseptal puncture and advancement of left atrial sheath.
Radial ICE Guidance of Transseptal Puncture for Left Atrial Access
Figure 1 Radial ICE Guidance of Transseptal Puncture for Left Atrial Access. The left and right atria are well-visualized with the ICE catheter in the right atrium along the interatrial septum in the fossa ovalis. One can see the tenting evident when transseptal needle is in good contact with the interatrial septum.
Left Atrial Ablations can be enhanced and accomplished using intra left atrial radial ICE (with intraprocedural heparinization for ACT>300). [1,2,3] Radial ICE is a useful adjunct imaging technique for several reasons. First, direct visualization of the electrode-endocardial interface allows precise positioning of the ablation electrode to guide lesion formation. Second, radial ICE permits the delivery of “focal” left atrial ablative lesions; the electrode kept in same location throughout energy application by manipulating the ablation electrode into firm, stable endocardial contact during continuous ICE imaging of the electrode–endocardial interface. Third, the use of continuous radial ICE during atrial fibrillation ablations allows close monitoring of catheter position and endocardial contact while minimizing dependence on fluoroscopy. Figure 2 depicts a typical view obtained when radial ICE is positioned in the left atrium using a steerable sheath (Agilis, St. Jude Medical, Inc., St. Paul, MN).
Intra Left Atrial Radial ICE Imaging During Atrial Fibrillation Ablation Left Pulmonary Venous Antrum Isolation
Figure 2 Intra Left Atrial Radial ICE Imaging During Atrial Fibrillation Ablation Left Pulmonary Venous Antrum Isolation. The radial ICE catheter is positioned at the entrance to the left PV antrum with the tip of the ablation catheter (Thermocool irrigated tip, Biosense Webster Inc, Diamond Bar, CA) located at ~9 o’clock on the antrum. The inset shows the analogous location of ablation catheter on 3D CT reconstruction of the left PV antrum.
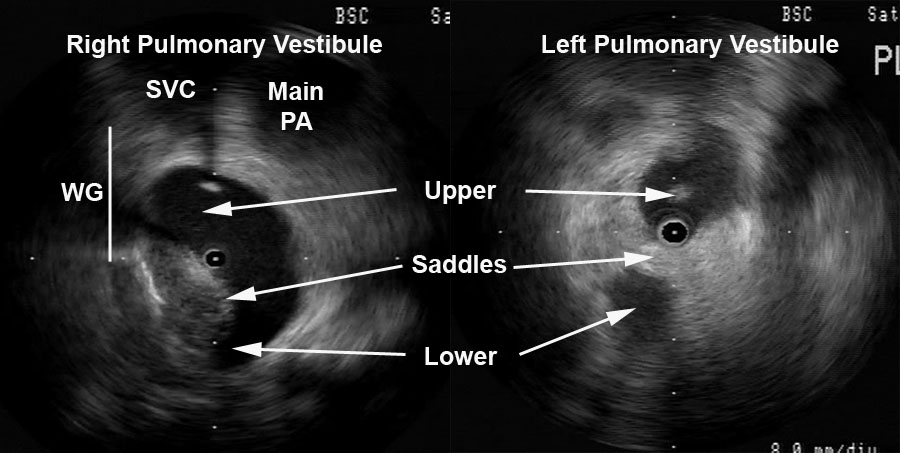
Detailed anatomy of the pulmonary veins can also aid in catheter positioning and stability as well as monitor for procedural complications (discussed later). Figure 3 provides views of the left and right pulmonary vestibules. The left upper (LUPV) and lower pulmonary veins (LLPV) are visualized as are the saddles. The right intervenous saddle is not as clearly differentiated as the left in this particular example to give the reader a better overall view of the structures surrounding the right pulmonary vestibule such as SVC, main PA, and Waterston’s groove (WG). Waterston’s groove is a fat-filled depression formed as the left and right atria fold into one another; Waterston’s groove is often dissected by surgeons to expose the left atrium. Radial ICE can be carefully placed within each individual pulmonary veins to guide catheter ablation as previously described. [1,2,3]
Radial ICE Anatomy of Left and Right Pulmonary Vestibules
Figure 3 Radial ICE Anatomy of Left and Right Pulmonary Vestibules. The right pulmonary vestibule is shown with the early portions of the upper and lower pulmonary veins. Superior to the right pulmonary veins one can see the main pulmonary artery and superior vena cava. The approximate location of Waterston’s groove is depicted by the solid line. A more distal view of the left pulmonary vestibule (compared to Figure 2) clearly differentiates the upper and lower PV’s as well as the intervenous saddle.
Radial ICE can also help guide linear ablation along the LA posterior wall for mitral annular flutter. Direct visualization of the left lower pulmonary vein, the posterior wall of the LA, the mitral annulus, and CS during ablation (both intra LA and CS) can improve catheter contact allowing for complete linear ablation and bidirectional block (see Figure 4).
Ablation Near Mitral Annulus
Figure 4 Ablation Near Mitral Annulus. A depicts the intra-LA radial ICE catheter with ablation catheter along the floor of left atrium near mitral annulus. B shows a similar view demonstrating the ablation catheter in the CS. Endocardial (and CS) contact and possible ablation injury can be visualized during lesion delivery.
Note: This is adapted from work I did with Dr. Sheetal Chandhok.
References:
1 Schwartzman D, Nosbisch J, Housel D. Echocardiographically guided left atrial ablation: characterization of a new technique. Heart Rhythm, V. 3 (2006), pp. 930–938.
2 Schwartzman D, Williams JL, “On the Electroanatomic Properties of Pulmonary Vein Antral Regions Enclosed by Encircling Ablation Lesions,” Europace , V. 11 (2009), pp. 435–444.
3 Chandhok S, Williams JL, Schwartzman DS, “Anatomical analysis of recurrent conduction after circumferential ablation,” J Intervent Card Electrophysiol, V. 27, No. 1 (January 2010), pp. 41-50.
Radial ICE (UltraICE™, Boston Scientific, Natick, MA, USA) uses a mechanical, 9 Fr, 9 MHz catheter, with 360° radial image. The ultrasound transducer rotates every 1.4° and with full mechanical rotation of the transducer (hence, 256 stacked lines of ultrasound data), a panoramic 360° image is created that is perpendicular to the catheter shaft at the tip. Radial ICE does not offer doppler capability and image definition is not as good as phased array ICE. Radial ICE’s 360° scan has a larger field of view and allows for a more comprehensive depiction (compared to phased array) of both atrial chambers and atrioventricular valves with their relationships and it also can be used as intravascular ultrasound for great vessels. Phased-array 8 French, 4.5–11.5 MHz catheter (AcuNavTM Ultrasound Catheter, Biosense Webster Inc., Diamond Bar, CA) has a 90° sector image, Doppler capability, and is deflectable. Radial ICE’s mechanical transducer is a non-deflectable catheter thus a steerable sheath (Zurpaz 8.5F Steerable Sheath, Boston Scientific Corporation, Natick, MA or Agilis, St. Jude Medical, St. Paul, MN) is required for precise catheter movements beyond transseptal puncture guidance.
Basic Cardiac Anatomy:
Figure 1 depicts the basic cardiac anatomy revealed with radial ICE and the analogous fluoroscopic views. The high SVC view permits view of the SVC and ascending aorta and the PA comes into view as one moves inferiorly towards the low SVC. The mid RA view tends to be the most useful view for orienting oneself in the right heart and (as discussed later) is the most useful view for transseptal access into the left atrium. The low RA view is useful for delineating complex IVC and CS anatomy.
Figure 1 Basic Cardiac Anatomy with Radial Intracardiac Echocardiography (ICE).
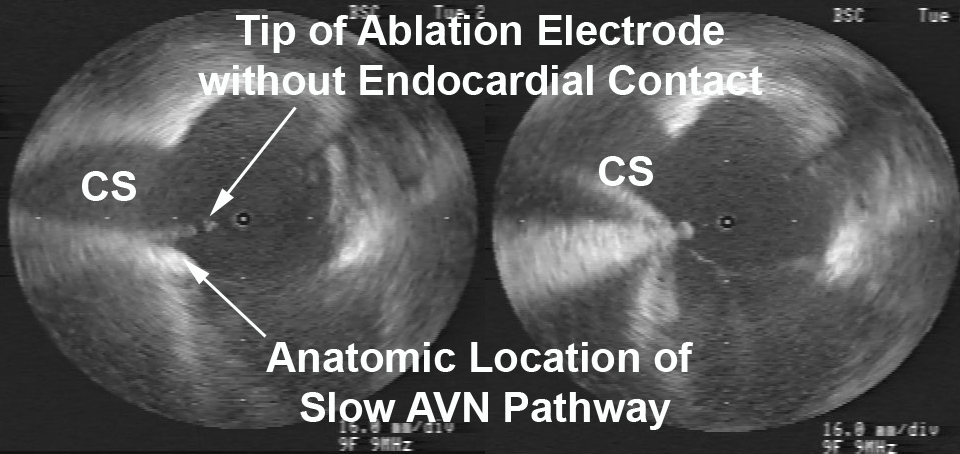
AV Node Reentrant Tachycardia requires careful catheter manipulation to modify the slow AV node pathway. Traditionally, slow AV node pathway modification is guided by fluoroscopic images and electrogram morphology. Radial ICE-guided AVNRT ablation has been well-described by Fisher et al. [1] Figure 2 depicts the radial ICE anatomy of the slow AVN pathway during an ablation for AVNRT. In this case, the patient had a persistent left superior vena cava (SVC) and ablation at attractive electrograms using fluoroscopic guidance did not yield a successful ablation.
Figure 2 Radial ICE Guidance during AVNRT Ablation of the Slow AV Node Pathway.
Figure 2 Radial ICE Guidance during AVNRT Ablation of the Slow AV Node Pathway. The left image depicts initial ablation catheter not in contact with the endocardial location of slow AVN pathway. The right image clearly depicts adequate electrode-endocardial contact which resulted in a successful ablation.
Radial ICE imaging was then used (with ICE catheter directional guidance via steerable sheath) to anatomically guide the ablation electrode to the slow AVN pathway which is located in the region at the anterior edge of the CS os near the septal insertion of the tricuspid valve leaflet (e.g., the anterior border of triangle of Koch). The left image shows the initial ablation catheter position and clearly demonstrates the electrode is not in contact with the endocardium. Ablation catheter manipulation to the location depicted in the right image led to an immediately successful ablation. Radial ICE guidance during AVNRT ablations allows one to visualize and ensure catheter stability during the ablation to avoid accidental catheter migration as compared to fluoroscopy which does not permit one to constantly monitor the electrode-endocardial interface.
AV Node Ablation can generally be performed under RAO and LAO fluoroscopic guidance however, there are times when the compact AV node cannot be ablated using traditional right atrial ablation techniques or only right bundle branch block can be obtained. Radial ICE can be used to complete AV node ablation by catheter guidance to the leftward extension of the His purkinje system prior to attempting a retrograde aortic approach to AV node ablation (which often requires an 8 French right femoral arterial sheath). Figure 3 depicts a typical site where complete heart block can be obtained by ablating more proximate to the leftward extension of the His bundle.
Figure 3 Completion of AV Nodal Ablation under Radial ICE Guidance.
Figure 3 Completion of AV Nodal Ablation under Radial ICE Guidance. This figure depicts radial ICE catheter location in the RVOT near the level of aortic valve. The radial ICE allows catheter position nearer to the leftward extension of the His purkinje system in an attempt to complete AV node ablation.
Radial ICE can be used for detailed assessment of RA anatomy especially during mapping of difficult atrial tachycardias. Figure 4 shows the level of RA detail radial ICE can provide to assist EP study catheter localization.
Figure 4 Radial ICE Assessment of RA Anatomy. Figure from Springer, Journal of Interventional Cardiac Electrophysiology
Figure 4 Radial ICE Assessment of RA Anatomy. Right atrial anatomy is nicely visualized with radial ICE and corresponding anatomic specimen. One can see how adjunctive imaging during difficult RA ablation may help visualize catheter position and endocardial contact. Figure taken from Springer, Journal of Interventional Cardiac Electrophysiology [2].
Oftentimes, catheter access of the CS can be difficult due to anatomic variants involving both the Eustachian ridge (when using femoral venous access) and Thebesian valves. The Eustachian valve continues superiorly from the IVC as the Tendon of Todaro that forms the Eustachian ridge (forming the superior aspect of the triangle of Koch). [3] Additionally, prior reviews of CS anatomy (4) revealed the presence of Thebesian valves (rudimentary valve covering CS os) in 80% of cases. It covered one-fifth in 7%, one-third the os in 29%, one-half in 27%, two-thirds in 14%, and the entire os in 5%. Figure 5 depicts radial ICE imaging of both anatomic variants. A minimally fenestrated Thebesian valve can make CS access unfeasible as in this case. A prominent Eustachian ridge can mandate CS access using a subclavian or jugular venous approach as it often impedes catheter placement when using a femoral venous approach.
Figure 5 Radial ICE Imaging of CS Anatomic Variants.
Figure 5 Radial ICE Imaging of CS Anatomic Variants. The left image shows a Thebesian valve with no obvious fenestrations covering the CS os. The right image shows a prominent Eustachian ridge extending from the IVC and overlying the superior aspect of the CS os.
Check Back for:
Part 2 Radial Intracardiac Echocardiography in the EP Lab: Left Atrial Procedures
Part 3 Radial Intracardiac Echocardiography in the EP Lab: Monitoring Procedural Complications
Part 4 Radial Intracardiac Echocardiography in the EP Lab: Electroanatomic Correlates During Radial ICE
Note: This is adapted from work I did with Dr. Sheetal Chandhok.
References:
1 Fisher WG, Pelini MA, Bacon ME, “Adjunctive Intracardiac Echocardiography to Guide Slow Pathway Ablation in Human Atrioventricular Nodal Reentrant Tachycardia: Anatomic Insights,” Circulation, V. 96 (1997), pp. 3021-3029.
2 Morton JB and Kalman JM, “Intracardiac Echocardiographic Anatomy for the Interventional Electrophysiologist,” J Int Cardiac Electrophysiology, V. 13 (2005), pp. 11-16.
3 Ho SY and Ernst S, Anatomy for Cardiac Electrophysiologists (2012; Cardiotext Publishing, LLV, Minneapolis, MN).
4 Pejkovic B, Krajnc I, Anderhuber F, Kosutic D, “Anatomical Variations of the Coronary Sinus Ostium Area of the Human Heart,” J Int Med Research, V. 36 (2008), pp. 314-321.
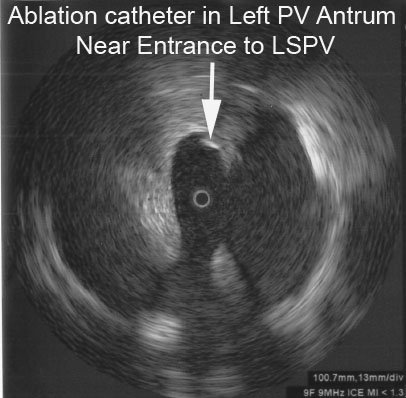
This is an interesting finding observed during a recent atrial fibrillation ablation performed in our Heart Rhythm Center. The ablation paradigm has been previously described [1] and consists of a pulmonary venous antrum isolation using entrance and exit block criteria guided by intra left atrial radial intracardiac echocardiography (ICE). During the initial antrum encircling lesion asystole developed (see following figure), ablation was stopped, and sinus rhythm recovered within 10seconds.
The following radial ICE image demonstrates the ablation catheter location in the superior aspect of the left pulmonary venous antrum near the left atrial appendage.
Bradycardia is often seen during atrial fibrillation ablations when proximate to autonomic ganglionic plexi. [2] I routinely see fluctuations in basal sinus rate during pulmonary venous antrum ablations but this was more dramatic than the sinus rate changes I usually observe. This location as seen on the intra left atrial radial ICE shot is slightly more anterior than the left superior ganglionic plexus is usually expected. The following figure shows a CT reconstruction of the posterior left atrium and pulmonary venous antra. The red dots depict a typical venous antrum ablation lesion set and the yellow areas denote the approximate locations of the ganglionic plexi. [3] Discontinuation of ablation led to quick restoration of sinus rhythm and repeat ablation near this location to finalize lesion set did not result in repeat asystole or significant fluctuations in sinus rate.
Another possible explanation for this finding is acute sinus node dysfunction (from damage to the sinus node artery, SNA) during ablation in the anterior left atrium. Chugh et al present an excellent review of coronary arterial injury during ablation of atrial fibrillation. [4] Though there was no obvious PR prolongation prior to the pause suggesting an autonomic effect, there was also no obvious sinus tachycardia or acceleration serving as a “harbinger of impending [sinus node] dysfunction.” Though the SNA arises from the RCA in two-thirds of patients, the remainder of SNA arise from an early branch of the circumflex which “passes superiorly and to the right of the LAA and courses over the anterior LA before terminating at the cavoatrial junction.” Less commonly, the SNA branches off a more distal portion of the circumflex and ascends in the lateral ridge between the appendage and the left pulmonary veins. The patient had an uneventful post-ablation recovery.
2 Pappone C, et al “Pulmonary vein denervation enhances long-term benefit after circumferential ablation for paroxysmal atrial fibrillation,” Circulation, V. 109 (2004), p. 327.
3 Katritsis DG et al, “Autonomic Denervation Added to Pulmonary Vein Isolation for Paroxysmal Atrial Fibrillation A Randomized Clinical Trial,” JACC, V. 62 (December 2013), pp. 2318–25.
4 Chugh A et al, “Manifestations of coronary arterial injury during catheter ablation of atrial fibrillation and related arrhythmias,” Heart Rhythm, V. 10, No. 11 (November 2013), pp. 1638-1645.
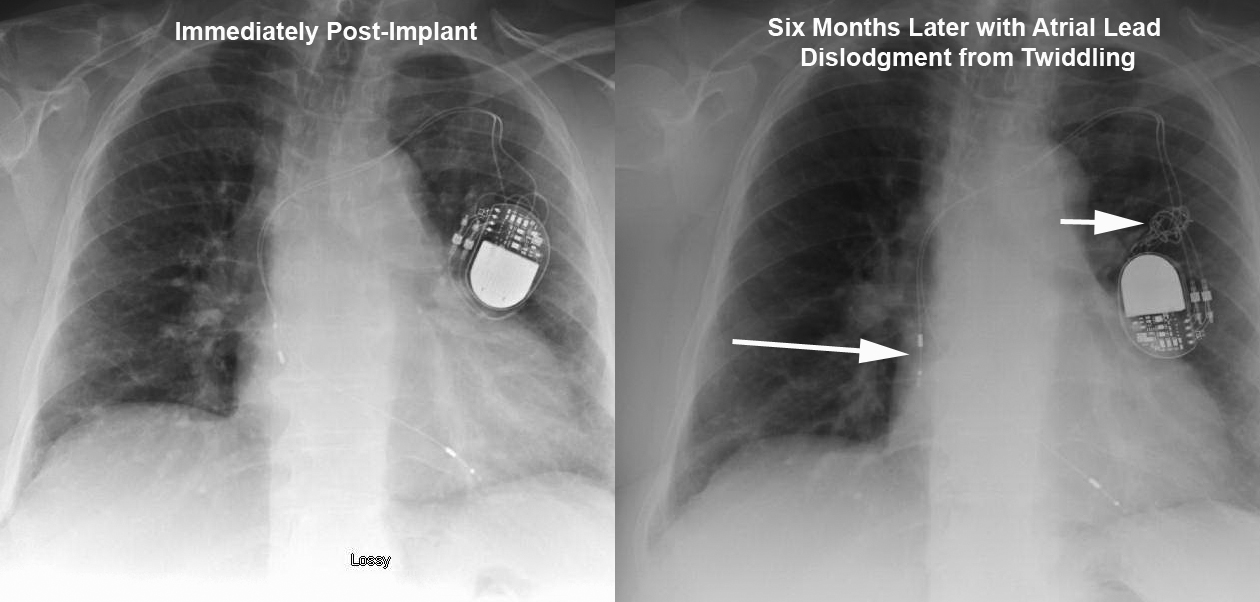
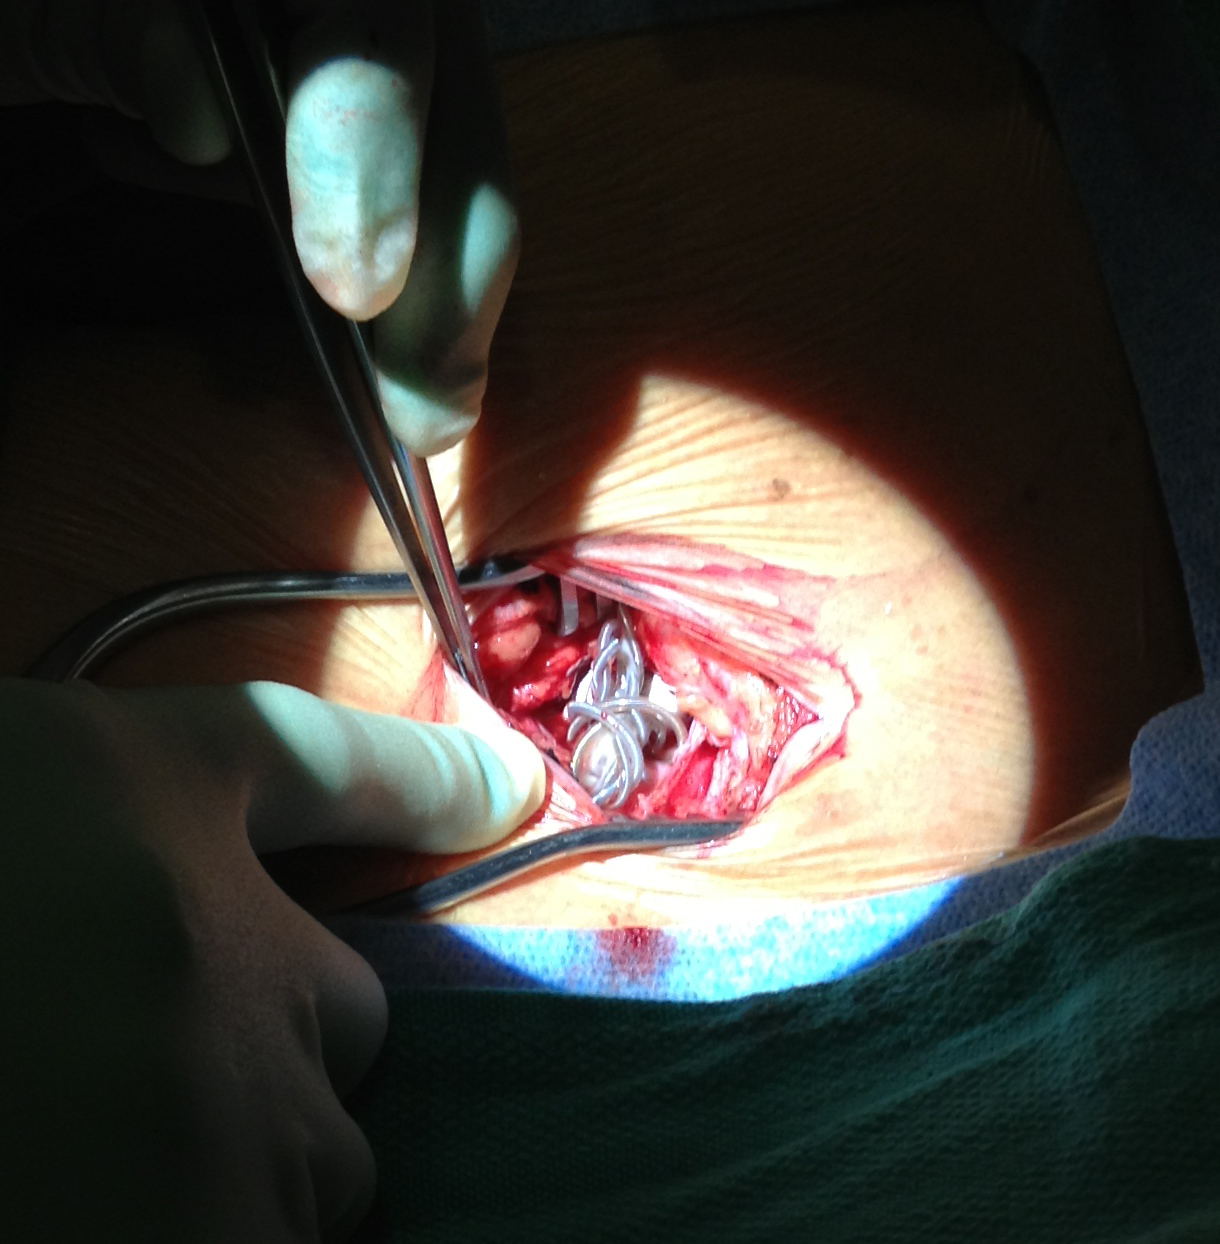
This elderly patient presented 6months after a dual chamber pacemaker was implanted due to symptomatic chronotropic incompetence. They reported recurrence of exertional shortness of breath that was experienced before pacemaker implantation. Device interrogation revealed complete loss of capture in the atrial lead. The top Figure depicts lead orientation before (left) and after (right) patient twiddling resulted in loss of slack in both leads with frank atrial lead dislodgement. Arrows show the dislodged atrial lead and knotted leads. The bottom Figure shows the intraoperative finding of knotted leads in the pocket. The leads were carefully unknotted, stylets placed, and leads repositioned with normal parameters. Originally described in 1968 [1], twiddling refers to patient manipulation of pacemaker can or leads that may lead to malfunction. It has a reported incidence of 0.07% in a series of 17000 patients. [2] The patient underwent an uneventful lead revision by repositioning the atrial lead and adding slack to the ventricular lead.
1 Bayliss CE, Beanlands DS, Baird RJ, “The pacemaker-twiddler’s syndrome: a new complication of implantable transvenous pacemakers,” Can Med Assoc J, V. 99 (1968), pp. 371–3.
2 T. Fahraeus and C. J. Hoijer, “Early pacemaker twiddler syndrome,” Europace, Vol. 5 (July 2003), pp. 279-281.