Steam Pops During Radiofrequency Ablation

Both non-irrigated and irrigated tip catheters for radiofrequency ablation (RFA) can cause steam pops with abrupt impedance rises probably owing to release of steam from excessive heating below the surface. [1] Saline irrigation maintains a low electrode-endocardial interface temperature during RFA at higher powers, which prevents an impedance rise and produces deeper and larger lesions. But you can see higher temperatures deeper in the cardiac wall (~3.5mm) than at the electrode-endocardial interface. This is thought to be due to direct resistive heating rather than by conduction of heat from the surface. [1] This excessive heating may cause water in the endocardium to vaporize into a gas bubble. Continued ablation (and hence heat formation) can cause this bubble to expand with increased pressure. If this gas bubble suddenly bursts inward toward the endocardium or outward to the epicardium, it can cause an audible “pop.”

The following video (courtesy of Dr. Dave Schwartzman, UPMC, Pittsburgh, PA) shows an ex vivo tissue preparation and formation of a steam pop during application of RFA. A significant concern of steam pops is the risk of cardiac perforation. Perforation with tamponade was seen in 1 of 62 (2%) VT ablations where a steam pop occurred. [2] The RFA applications with steam pops had a higher maximum power but did not differ in maximum catheter tip temperature. It reasons that steam pops in the pulmonary veins or atria may pose higher risk of perforation.

A middle-aged male with no significant medical history underwent an EP study and ablation for typical atrioventricular node reentrant tachycardia (AVNRT). The AVNRT ablation was being guided by radial intracardiac echocardiography. RFA (using power-control setting) is attempted at the anatomic location of the slow AVN pathway region at the anterior edge of the CS os near the septal insertion of the tricuspid valve leaflet (see Figure). Power was titrated from 5W to 30W but required 40W to demonstrate an accelerated junctional rhythm associated with ablation success. A steam pop was felt and evidence of a small defect in the endocardium in the region was noted on radial ICE as shown in Figure. There was no obvious microbubble formation evident on radial ICE prior to the steam pop. Subsequent echocardiograms demonstrated no evidence of perforation or tamponade and patient was asymptomatic at follow-up several weeks later.
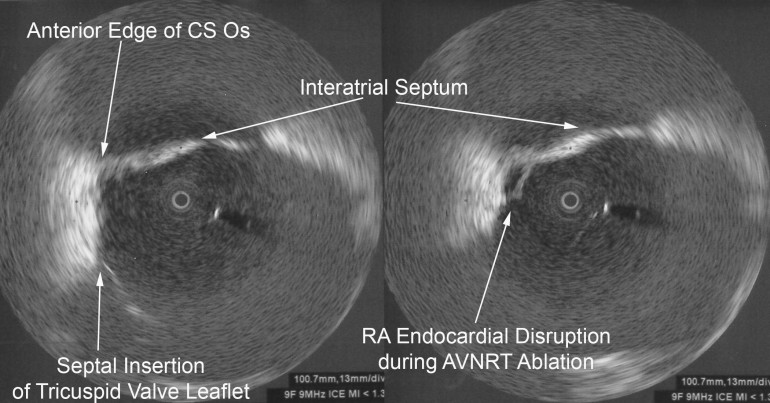
Radial ICE showing the anatomic location of the slow AVN pathway and effects of a steam pop after RFA.


References:

1  Nakagawa H et al, “Comparison of In Vivo Tissue Temperature Profile and Lesion Geometry for Radiofrequency Ablation With a Saline-Irrigated Electrode Versus Temperature Control in a Canine Thigh Muscle Preparation,” Circulation (1995), V. 91, pp. 2264-2273.

2     Seiler J et al, “Steam pops during irrigated radiofrequency ablation: feasibility of impedance monitoring for prevention,” Heart Rhythm (Oct 2008), V. 5, No. 10, pp. 1411-1416.

 

Part 4 Radial Intracardiac Echocardiography in the EP Lab: Electroanatomic Correlates

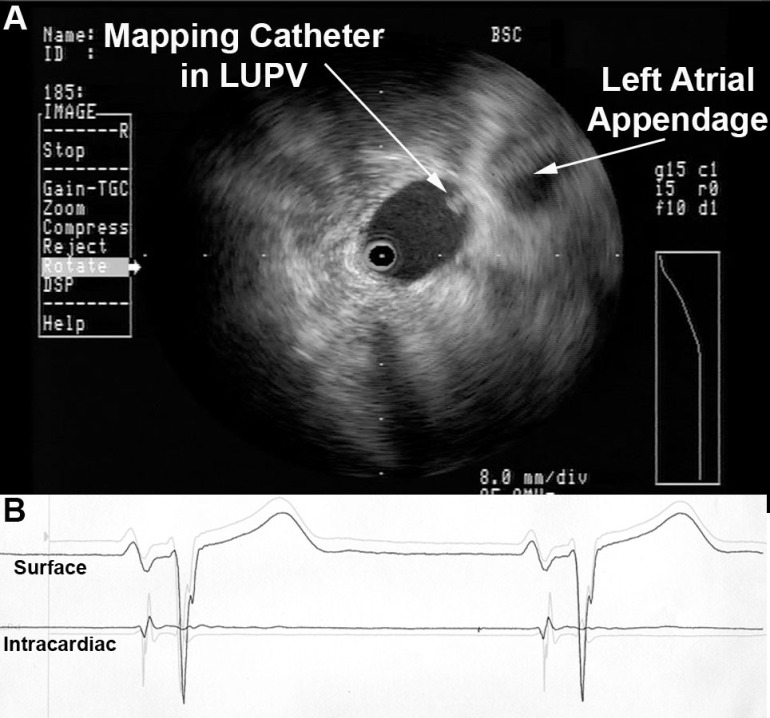
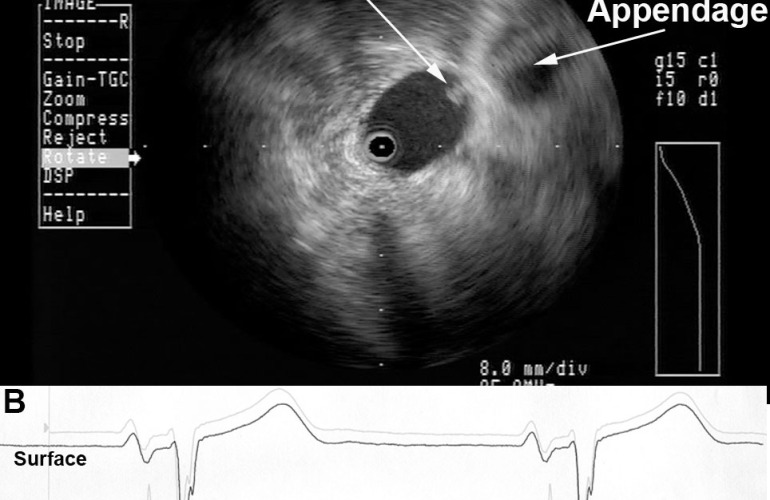
Radial ICE can be used to obtain especially informative electroanatomic correlations and has been described extensively during atrial fibrillation ablations. [1,2,3] Aside from guiding the localization of pulmonary vein potentials during intra left atrial ICE guided procedures (shown in Radial ICE for Left Atrial Procedures) there are several instances where radial ICE facilitated electroanatomic correlates can discern situations where ablation is not necessary during atrial fibrillation ablations. The left atrial appendage is often located quite close to the left superior pulmonary vein and left atrial appendage far-field electrograms can be confused with pulmonary vein potentials if this is not suspected based upon electroanatomic correlation. Figure 1A depicts the radial ICE catheter positioned in the left superior pulmonary vein (adjacent to the left atrial appendage) and 1B shows the intracardiac electrograms (EGM) recorded in the left upper PV (darker, smaller amplitude) and LAA (lighter, larger amplitude); The LUPV signal appears to be a low-pass filtered version of the LAA signal.

Left Atrial Appendage Electrogram Mimicking Left Upper PV Potential

Figure 1 Left Atrial Appendage Electrogram Mimicking Left Upper PV Potential. Image A depicts the radial ICE catheter positioned in the left superior pulmonary vein and B shows the corresponding intracardiac electrogram (EGM) recorded in the left superior PV (darker, smaller amplitude). EGM’s from within the LUPV (darker) and LAA (lighter, larger amplitude) are superimposed.

One can also see potentials derived from contiguous myocardium outside the region subtended by catheter ablation of atrial fibrillation. [2,3] These potentials may be located near the LA roof in region of Waterston’s groove, proximal Bachmann’s bundle, and superior caval musculature. For example, distinct EGM’s can be recorded from within the right superior pulmonary vein that may look like, but do not represent, latent PV potentials.

Myocardial Potential in the Right Upper Pulmonary Vein that may Represent Bachmann’s Bundle Potential

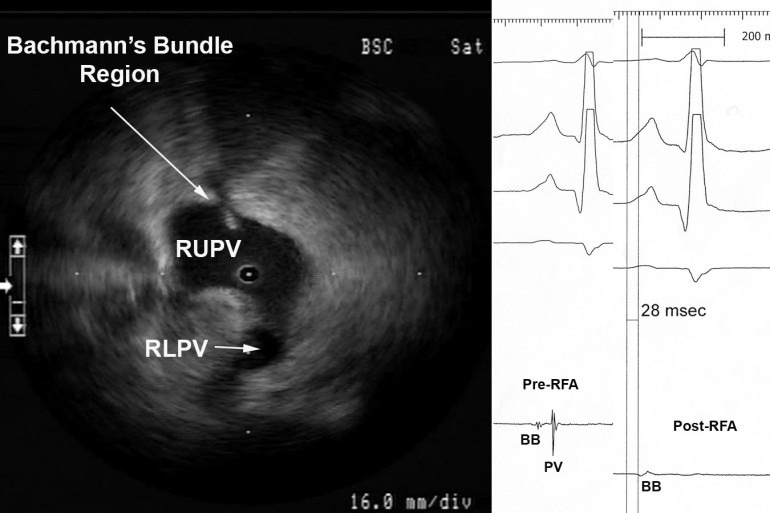
Figure 2 Myocardial Potential in the Right Upper Pulmonary Vein that may Represent Bachmann’s Bundle Potential. The ICE image shows typical right pulmonary venous antral image with the tip of ICE catheter just within the entrance to the RUPV and the RLPV obliquely viewed. The ablation catheter is located on the roof of the RUPV. A myocardial potential located ~28msec after the onset of the surface P wave is shown before (pre-RFA) and after (post-RFA) ablation of pulmonary vein (PV) potential. We surmise (though cannot prove) that this myocardial potential represents Bachmann’s bundle potential (BB).


Figure 2 shows the typical radial ICE view when positioned in the right upper pulmonary vein. There are two distinct EGM’s recorded; the earlier signal ~28 msec after the onset of the surface P wave and the later signal ~70msec after the onset of the surface P wave. The later signal represents a true pulmonary vein (PV) potential that is successfully ablated and the earlier signal remains after the ablation; we surmise (though cannot prove) this represents Bachmann’s bundle potential (BB). This signal can often be seen in the right upper pulmonary vein <30msec after the onset of the surface P wave and its presence does not reflect residual PV potentials. Bachmann’s bundle (also called the interauricular band) has a myoarchitecture that displays parallel alignment of fibers along distinct muscle bundles. [5] Bachmann’s bundle extends from the SVC, crossing the interatrial groove, passing leftward in the left atrium.


Discussion:

Intracardiac radial ICE can provide detailed anatomy, guide catheter ablation, enhance procedural safety, and facilitate ablative strategies; it is readily available but generally underutilized. Furthermore, ICE has utility for reducing fluoroscopy times by rendering the operator less dependent upon traditional fluoroscopic monitoring of catheter movement and position. [4,6] Radial intracardiac echo offers 360º views of cardiac anatomy not commonly encountered with traditional phased array catheter or even transthoracic/transesophageal echo though it offers comprehensive utility in guiding EP procedures.


References:

1     Schwartzman D, Nosbisch J, Housel D. Echocardiographically guided left atrial ablation: characterization of a new technique. Heart Rhythm, V. 3 (2006), pp. 930–938.

2     Schwartzman D, Williams JL, “On the Electroanatomic Properties of Pulmonary Vein Antral Regions Enclosed by Encircling Ablation Lesions,” Europace , V. 11 (2009), pp. 435–444.

3     Chandhok S, Williams JL, Schwartzman DS, “Anatomical analysis of recurrent conduction after circumferential ablation,” J Intervent Card Electrophysiol, V. 27, No. 1 (January 2010), pp. 41-50.

4     Ferguson JD, Helms A, Mangrum JM, Mahapatra S, Mason P, Bilchick K, McDaniel G, Wiggins D, and DiMarco JP, “Catheter ablation of atrial fibrillation without fluoroscopy using intracardiac echocardiography and electroanatomic mapping,” Circ Arrhythm Electrophysiol, V. 2, No. 6 (December 2009), pp. 611-619.

5 HO02     Ho SY, Anderson RH, Sánchez-Quintana D.  Atrial structure and fibres: morphologic bases of atrial conduction. Cardiovascular Res. 2002;54:325-336.

6 Khaykin Y, Skanes A, Whaley B, Hill C, Beardsall M, Seabrook C, Wulffhart Z, Oosthuizen, Gula L, Verma A, “Real-time integration of 2D intracardiac echocardiography and 3D electroanatomical mapping to guide ventricular tachycardia ablation,” Heart Rhythm, V. 5, No. 10 (October 2008), pp. 1396-1402.